Categories in Ipala
Industries
Business Distribution by Industry in Ipala
| Industry Description | Number of Establishments |
|---|---|
| Restaurants | 24 |
| Churches | 24 |
| Shopping | 15 |
| Education | 15 |
| Hardware store | 12 |
| Public parks | 10 |
| Gas station | 9 |
| Car repair | 9 |
| Grocery stores and supermarkets | 8 |
| Pharmacies and drug stores | 8 |
| Hotels and motels | 7 |
| Cafes | 7 |
| Clothing stores | 6 |
| Cemeteries and crematoriums | 6 |
Ipala Facts
| Area | 192.9 km² |
| Population | 22,235 |
| Male Population | 10,561 (47.5%) |
| Female Population | 11,674 (52.5%) |
| Population change (1975 to 2020) | +40.0% |
| Population change (2000 to 2020) | +6.6% |
| Median Age | 18.7 years (Male: 17.8, Female: 19.5) |
| GDP per capita (PPP) | $8,073 (2022) |
| Local Time | |
| Timezone | Central Standard Time |
| Lat & Lng | 14.61667, -89.61667 |
| Postal Codes | 20011 |
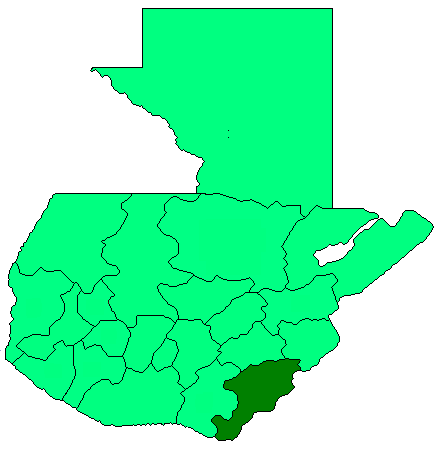
Map of Ipala
Interactive Map
Ipala Population
Years 1975 to 2030
| Data | 1975 | 1990 | 2000 | 2015 | 2020 | 2025* | 2030* |
|---|---|---|---|---|---|---|---|
| Population | 15,877 | 18,812 | 20,850 | 22,981 | 22,235 | 23,836 | 25,295 |
| Population Density | 82.3 / km² | 97.5 / km² | 108.1 / km² | 119.1 / km² | 115.2 / km² | 123.5 / km² | 131.1 / km² |
Ipala Population change from 2000 to 2020
Increase of 6.6% from year 2000 to 2020
| Location | Change since 1975 | Change since 1990 | Change since 2000 |
|---|---|---|---|
| Ipala | +40% | +18.2% | +6.6% |
| Chiquimula | — | — | — |
| Guatemala | — | — | — |
Ipala Median Age
Median Age: 18.7 years
| Location | Median Age | Median Age (Female) | Median Age (Male) |
|---|---|---|---|
| Ipala | 18.7 yrs | 19.5 yrs | 17.8 yrs |
| Chiquimula | 18.7 yrs | 19.5 yrs | 17.8 yrs |
| Guatemala | 18.6 yrs | 19.5 yrs | 17.8 yrs |
Ipala Population Density
Population Density: 115 / km²
| Location | Population | Area | Density |
|---|---|---|---|
| Ipala | 22,235 | 192.9 km² | 115 / km² |
| Chiquimula | 411,113 | 2,394.3 km² | 172 / km² |
| Guatemala | 16.3 million | 109,009.9 km² | 149 / km² |
Ipala Historical and Projected Population
Estimated Population from 0 to 2100
- JRC (European Commission's Joint Research Centre) work on the GHS built-up grid
- CIESIN (Center for International Earth Science Information Network)
- [Link] Klein Goldewijk, K., Beusen, A., Doelman, J., and Stehfest, E.: Anthropogenic land use estimates for the Holocene – HYDE 3.2, Earth Syst. Sci. Data, 9, 927–953, https://doi.org/10.5194/essd-9-927-2017, 2017.
Area Codes
Percentage Area Codes used by businesses in Ipala
Price Distribution
Business distribution by price for Ipala
Human Development Index (HDI)
Statistic composite index of life expectancy, education, and per capita income.
Ipala Gross Domestic Product (GDP)
GDP per capita, PPP (constant 2017 international $)
| Data | 1990 | 1995 | 2000 | 2005 | 2010 | 2015 | 2020 | 2022 |
|---|---|---|---|---|---|---|---|---|
| GDP per capita | $2,022 | $2,074 | $3,584 | $7,409 | $6,234 | $7,063 | $7,172 | $8,073 |
| Total GDP | $18.8M | $21.9M | $41.5M | $91.1M | $79.1M | $88.7M | $89.6M | $103.6M |
Ipala CO2 Emissions
Carbon Dioxide (CO2) Emissions Per Capita in Tonnes Per Year
| Location | CO2 Emissions | CO2 Emissions Per Capita | CO2 Emissions Intensity |
|---|---|---|---|
| Ipala | 23,907 tn | 1.08 tn | 123.9 tons/km² |
| Chiquimula | 446,969 tn | 1.09 tn | 186.7 tons/km² |
| Guatemala | 17,248,451 tn | 1.06 tn | 158.2 tons/km² |
| 2013 CO2 emissions (tonnes/year) | 23,907 tn |
| 2013 CO2 emissions (tonnes/year) per capita | 1.08 tn |
| 2013 CO2 emissions intensity (tonnes/km²/year) | 123.9 tons/km² |
Natural Hazards Risk
Relative risk out of 10
| Hazard | Risk Level |
|---|---|
| Flood | High (9) |
| Earthquake | Medium (7) |
| Landslide | Medium (7) |
* Risk, particularly concerning flood or landslide, may not be for the entire area.
- Dilley, M., R.S. Chen, U. Deichmann, A.L. Lerner-Lam, M. Arnold, J. Agwe, P. Buys, O. Kjekstad, B. Lyon, and G. Yetman. 2005. Natural Disaster Hotspots: A Global Risk Analysis. Washington, D.C.: World Bank. https://doi.org/10.1596/0-8213-5930-4.
- Center for Hazards and Risk Research - CHRR - Columbia University, Center for International Earth Science Information Network - CIESIN - Columbia University, and Norwegian Geotechnical Institute - NGI. 2005. Global Landslide Hazard Distribution. Palisades, NY: NASA Socioeconomic Data and Applications Center (SEDAC). https://doi.org/10.7927/H4P848VZ.
- Center for Hazards and Risk Research - CHRR - Columbia University, Center for International Earth Science Information Network - CIESIN - Columbia University. 2005. Global Flood Hazard Frequency and Distribution. Palisades, NY: NASA Socioeconomic Data and Applications Center (SEDAC). https://doi.org/10.7927/H4668B3D.
- Center for Hazards and Risk Research - CHRR - Columbia University, Center for International Earth Science Information Network - CIESIN - Columbia University. 2005. Global Earthquake Hazard Distribution - Peak Ground Acceleration. Palisades, NY: NASA Socioeconomic Data and Applications Center (SEDAC). https://doi.org/10.7927/H4BZ63ZS.
Recent Nearby Earthquakes
Magnitude 3.0 and greater
| Date▼ | Time↕ | Magnitude↕ | Distance↕ | Depth↕ | Location↕ | Link |
|---|---|---|---|---|---|---|
| 4/5/19 | 11:53 PM | 4.4 | 53.3 km | 10,000 m | 10km NNE of Sinuapa, Honduras | usgs.gov |
| 5/27/18 | 7:16 PM | 4.4 | 48.2 km | 188,830 m | 3km SE of Jutiapa, Guatemala | usgs.gov |
| 4/29/18 | 5:19 PM | 4.2 | 53.2 km | 10,000 m | 5km SE of Atescatempa, Guatemala | usgs.gov |
| 4/25/18 | 10:18 PM | 4.9 | 55 km | 192,890 m | 5km ENE of Quesada, Guatemala | usgs.gov |
| 1/10/18 | 3:43 PM | 4.1 | 41.4 km | 246,210 m | 11km SW of Monjas, Guatemala | usgs.gov |
| 1/15/17 | 2:13 PM | 4.6 | 66.3 km | 211,920 m | 6km ESE of Casillas, Guatemala | usgs.gov |
| 10/9/16 | 10:55 PM | 4.8 | 64.7 km | 195,820 m | 4km N of San Jose Acatempa, Guatemala | usgs.gov |
| 8/31/16 | 4:46 AM | 4.2 | 62.4 km | 2,090 m | 5km SE of Jerez, Guatemala | usgs.gov |
| 8/29/16 | 1:05 PM | 4.6 | 54.7 km | 10,000 m | 0km NE of Candelaria de La Frontera, El Salvador | usgs.gov |
| 11/24/15 | 7:52 AM | 4.4 | 54 km | 169,000 m | 4km NW of El Adelanto, Guatemala | usgs.gov |


About Our Data
The data on this page is estimated using a number of publicly available tools and resources. It is provided without warranty, and could contain inaccuracies. Use at your own risk.