Pochuta Facts
| Area | 109.2 km² |
| Population | 12,273 |
| Male Population | 6,249 (50.9%) |
| Female Population | 6,024 (49.1%) |
| Population change (1975 to 2020) | +79.1% |
| Population change (2000 to 2020) | +24.2% |
| Median Age | 18.6 years (Male: 17.8, Female: 19.5) |
| Local Time | |
| Timezone | Central Standard Time |
| Lat & Lng | 14.55000, -91.08333 |
| Postal Codes | 04008 |
Map of Pochuta
Interactive Map
Pochuta Population
Years 1975 to 2020
| Data | 1975 | 1990 | 2000 | 2015 | 2020 |
|---|---|---|---|---|---|
| Population | 6,852 | 8,794 | 9,884 | 11,445 | 12,273 |
| Population Density | 62.8 / km² | 80.5 / km² | 90.5 / km² | 104.8 / km² | 112.4 / km² |
Sources: JRC (European Commission's Joint Research Centre) work on the GHS built-up grid
Pochuta Population change from 2000 to 2015
Increase of 15.8% from year 2000 to 2015
| Location | Change since 1975 | Change since 1990 | Change since 2000 |
|---|---|---|---|
| Pochuta | +67% | +30.1% | +15.8% |
| Chimaltenango Department | +217.2% | +99.6% | +49.2% |
| Guatemala | +161.9% | +78.4% | +39.8% |
Sources: JRC (European Commission's Joint Research Centre) work on the GHS built-up grid
Pochuta Median Age
Median Age: 18.6 years
| Location | Median Age | Median Age (Female) | Median Age (Male) |
|---|---|---|---|
| Pochuta | 18.6 yrs | 19.5 yrs | 17.8 yrs |
| Chimaltenango Department | 18.6 yrs | 19.5 yrs | 17.8 yrs |
| Guatemala | 18.6 yrs | 19.5 yrs | 17.8 yrs |
Sources: CIESIN (Center for International Earth Science Information Network)
Pochuta Population Density
Population Density: 112 / km²
| Location | Population | Area | Density |
|---|---|---|---|
| Pochuta | 12,273 | 109.2 km² | 112 / km² |
| Chimaltenango Department | 687,424 | 1,862.5 km² | 369 / km² |
| Guatemala | 16.3 million | 109,009.9 km² | 149 / km² |
Sources: JRC (European Commission's Joint Research Centre) work on the GHS built-up grid
Pochuta Historical and Projected Population
Estimated Population from 0 to 2100
Sources:
- JRC (European Commission's Joint Research Centre) work on the GHS built-up grid
- CIESIN (Center for International Earth Science Information Network)
- [Link] Klein Goldewijk, K., Beusen, A., Doelman, J., and Stehfest, E.: Anthropogenic land use estimates for the Holocene – HYDE 3.2, Earth Syst. Sci. Data, 9, 927–953, https://doi.org/10.5194/essd-9-927-2017, 2017.
Human Development Index (HDI)
Statistic composite index of life expectancy, education, and per capita income.
Source: [Link] Kummu, M., Taka, M. &Guillaume, J. Gridded global datasets for Gross Domestic Product and Human Development Index over 1990–2015. Sci Data 5, 180004 (2018) doi:10.1038/sdata.2018.4
Pochuta CO2 Emissions
Carbon Dioxide (CO2) Emissions Per Capita in Tonnes Per Year
| Location | CO2 Emissions | CO2 Emissions Per Capita | CO2 Emissions Intensity |
|---|---|---|---|
| Pochuta | 12,731 tn | 1.04 tn | 116.6 tons/km² |
| Chimaltenango Department | 741,622 tn | 1.08 tn | 398.2 tons/km² |
| Guatemala | 17,248,451 tn | 1.06 tn | 158.2 tons/km² |
Sources: [Link] Moran, D., Kanemoto K; Jiborn, M., Wood, R., Többen, J., and Seto, K.C. (2018) Carbon footprints of 13,000 cities. Environmental Research Letters DOI: 10.1088/1748-9326/aac72a
Pochuta CO2 Emissions
| 2013 CO2 emissions (tonnes/year) | 12,731 tn |
| 2013 CO2 emissions (tonnes/year) per capita | 1.04 tn |
| 2013 CO2 emissions intensity (tonnes/km²/year) | 116.6 tons/km² |
Natural Hazards Risk
Relative risk out of 10
| Hazard | Risk Level |
|---|---|
| Drought | High (10) |
| Flood | High (10) |
| Earthquake | High (8) |
| Landslide | High (9) |
| Volcano | Medium (4) |
* Risk, particularly concerning flood or landslide, may not be for the entire area.
Sources:
- Dilley, M., R.S. Chen, U. Deichmann, A.L. Lerner-Lam, M. Arnold, J. Agwe, P. Buys, O. Kjekstad, B. Lyon, and G. Yetman. 2005. Natural Disaster Hotspots: A Global Risk Analysis. Washington, D.C.: World Bank. https://doi.org/10.1596/0-8213-5930-4.
- Center for Hazards and Risk Research - CHRR - Columbia University, Center for International Earth Science Information Network - CIESIN - Columbia University, and Norwegian Geotechnical Institute - NGI. 2005. Global Landslide Hazard Distribution. Palisades, NY: NASA Socioeconomic Data and Applications Center (SEDAC). https://doi.org/10.7927/H4P848VZ.
- Center for Hazards and Risk Research - CHRR - Columbia University, Center for International Earth Science Information Network - CIESIN - Columbia University, and International Research Institute for Climate and Society - IRI - Columbia University. 2005. Global Drought Hazard Frequency and Distribution. Palisades, NY: NASA Socioeconomic Data and Applications Center (SEDAC). https://doi.org/10.7927/H4VX0DFT.
- Center for Hazards and Risk Research - CHRR - Columbia University, Center for International Earth Science Information Network - CIESIN - Columbia University. 2005. Global Flood Hazard Frequency and Distribution. Palisades, NY: NASA Socioeconomic Data and Applications Center (SEDAC). https://doi.org/10.7927/H4668B3D.
- Center for Hazards and Risk Research - CHRR - Columbia University, Center for International Earth Science Information Network - CIESIN - Columbia University. 2005. Global Volcano Hazard Frequency and Distribution. Palisades, NY: NASA Socioeconomic Data and Applications Center (SEDAC). https://doi.org/10.7927/H4BR8Q45.
- Center for Hazards and Risk Research - CHRR - Columbia University, Center for International Earth Science Information Network - CIESIN - Columbia University. 2005. Global Earthquake Hazard Distribution - Peak Ground Acceleration. Palisades, NY: NASA Socioeconomic Data and Applications Center (SEDAC). https://doi.org/10.7927/H4BZ63ZS.
Recent Nearby Earthquakes
Magnitude 3.0 and greater
| Date▼ | Time↕ | Magnitude↕ | Distance↕ | Depth↕ | Location↕ | Link |
|---|---|---|---|---|---|---|
| 4/30/19 | 2:13 PM | 4.3 | 21.7 km | 232,520 m | 4km SSW of Tecpan Guatemala, Guatemala | usgs.gov |
| 8/5/18 | 4:53 AM | 4.3 | 33 km | 112,980 m | 4km SSW of San Miguel Panan, Guatemala | usgs.gov |
| 3/23/18 | 5:16 PM | 4.6 | 23.6 km | 104,240 m | 5km SSE of Santa Barbara, Guatemala | usgs.gov |
| 11/8/17 | 8:28 AM | 4.3 | 25.3 km | 191,870 m | 6km W of Tecpan Guatemala, Guatemala | usgs.gov |
| 9/20/17 | 2:37 AM | 4.9 | 19.1 km | 178,930 m | 4km ENE of Acatenango, Guatemala | usgs.gov |
| 11/25/16 | 3:08 PM | 4.7 | 29.1 km | 195,310 m | 2km ESE of Santa Apolonia, Guatemala | usgs.gov |
| 5/8/16 | 7:52 AM | 4.7 | 21.7 km | 114,180 m | 6km SSE of Patulul, Guatemala | usgs.gov |
| 8/1/15 | 11:35 PM | 4.7 | 28.2 km | 205,490 m | 7km ENE of Concepcion, Guatemala | usgs.gov |
| 6/30/15 | 3:00 PM | 4.1 | 29.1 km | 58,810 m | 13km S of Patulul, Guatemala | usgs.gov |
| 8/31/14 | 7:14 AM | 4.3 | 14.8 km | 200,280 m | 2km SSW of San Antonio Palopo, Guatemala | usgs.gov |
Source: U.S. Geological Survey (USGS)
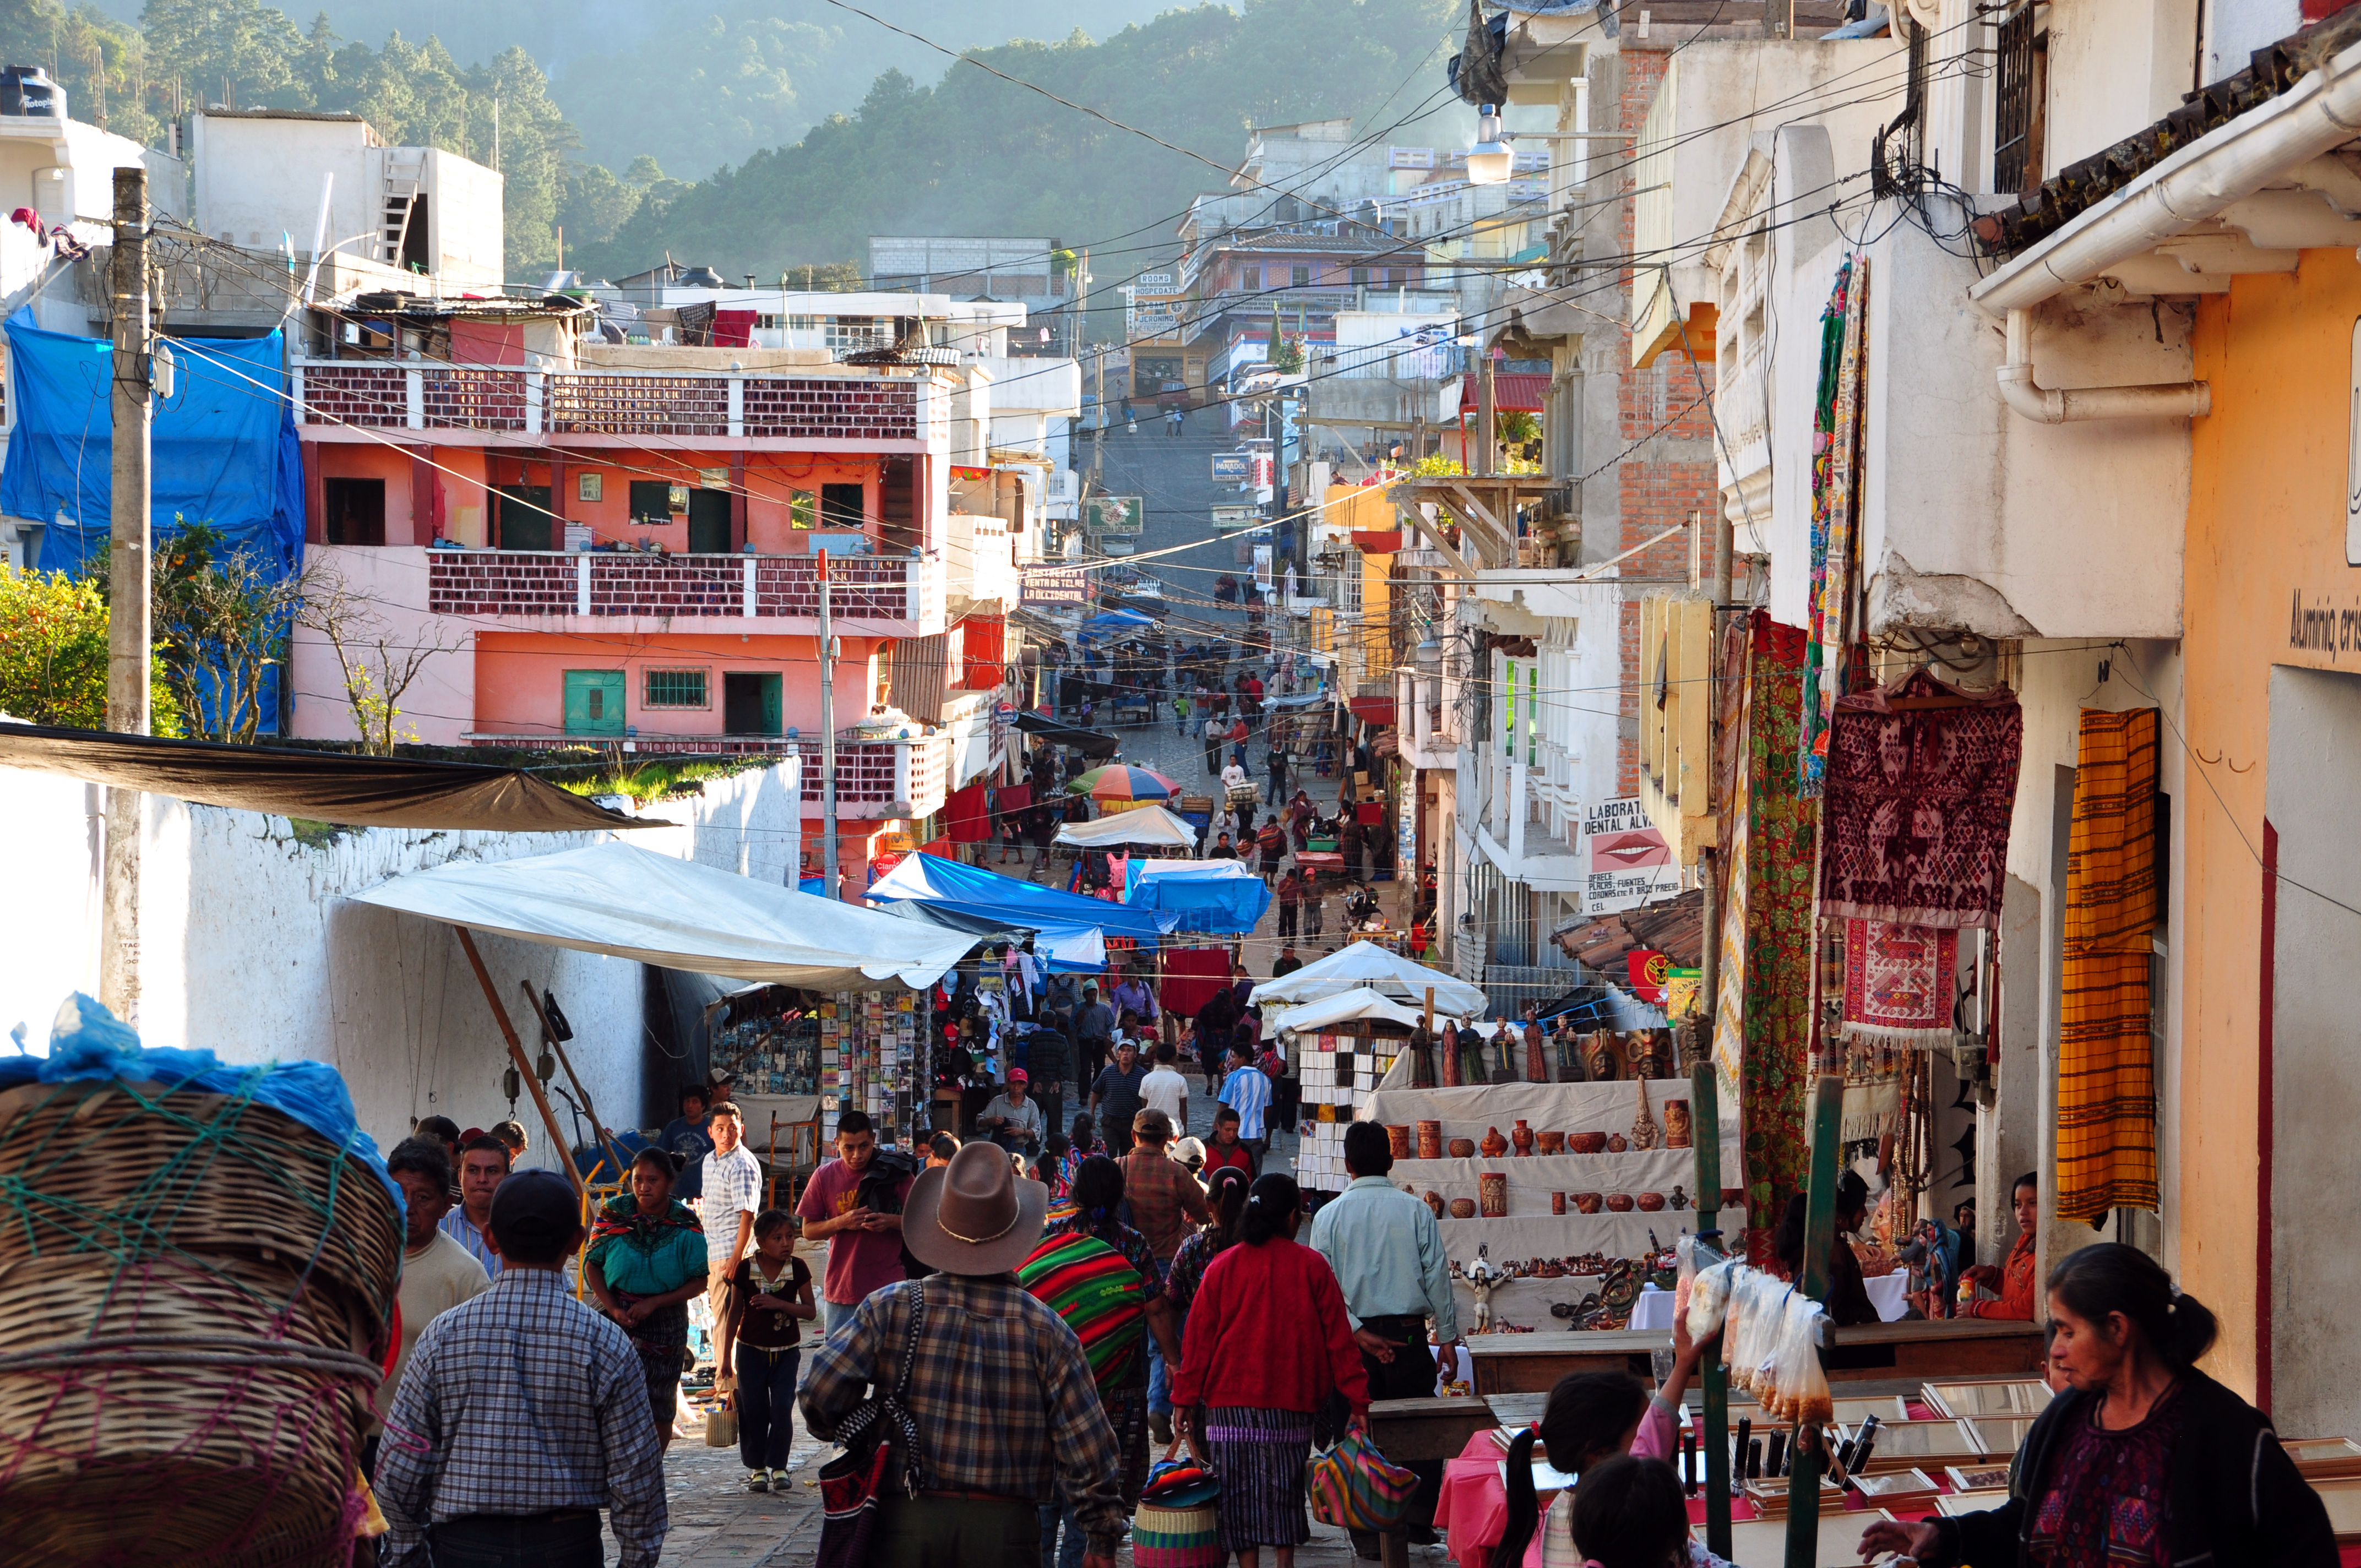
Pochuta
Pochuta is a municipality in the Chimaltenango department of Guatemala.
Pochuta Wikipedia Page

About Our Data
The data on this page is estimated using a number of publicly available tools and resources. It is provided without warranty, and could contain inaccuracies. Use at your own risk.