Categories in Gorjani
Gorjani Facts
| Area | 1.1 km² |
| Population | 692 |
| Male Population | 345 (49.8%) |
| Female Population | 347 (50.2%) |
| Population change (1975 to 2020) | -57.2% |
| Population change (2000 to 2020) | -31.3% |
| Median Age | 42.8 years (Male: 41.2, Female: 44.1) |
| Local Time | |
| Timezone | Central European Summer Time |
| Lat & Lng | 45.39889, 18.37222 |
| Postal Codes | 31422 |
Map of Gorjani
Interactive Map
Gorjani Population
Years 1975 to 2020
| Data | 1975 | 1990 | 2000 | 2015 | 2020 |
|---|---|---|---|---|---|
| Population | 1,615 | 1,416 | 1,007 | 699 | 692 |
| Population Density | 1,435.6 / km² | 1,258.7 / km² | 895.1 / km² | 621.3 / km² | 615.1 / km² |
Gorjani Population change from 2000 to 2015
Decrease of 30.6% from year 2000 to 2015
| Location | Change since 1975 | Change since 1990 | Change since 2000 |
|---|---|---|---|
| Gorjani | -56.7% | -50.6% | -30.6% |
| Osijek-Baranja County | -17.9% | -19.5% | -10.2% |
| Croatia | -6.1% | -11.4% | -4.3% |
Gorjani Median Age
Median Age: 42.8 years
| Location | Median Age | Median Age (Female) | Median Age (Male) |
|---|---|---|---|
| Gorjani | 42.8 yrs | 44.1 yrs | 41.2 yrs |
| Osijek-Baranja County | 41.8 yrs | 44 yrs | 39.5 yrs |
| Croatia | 42 yrs | 44.1 yrs | 40 yrs |
Gorjani Population Density
Population Density: 615 / km²
| Location | Population | Area | Density |
|---|---|---|---|
| Gorjani | 692 | 1.125 km² | 615 / km² |
| Osijek-Baranja County | 298,525 | 4,049.2 km² | 73.7 / km² |
| Croatia | 4.2 million | 56,366.2 km² | 73.9 / km² |
Gorjani Historical and Projected Population
Estimated Population from 0 to 2100
- JRC (European Commission's Joint Research Centre) work on the GHS built-up grid
- CIESIN (Center for International Earth Science Information Network)
- [Link] Klein Goldewijk, K., Beusen, A., Doelman, J., and Stehfest, E.: Anthropogenic land use estimates for the Holocene – HYDE 3.2, Earth Syst. Sci. Data, 9, 927–953, https://doi.org/10.5194/essd-9-927-2017, 2017.
Price Distribution
Business distribution by price for Gorjani
Human Development Index (HDI)
Statistic composite index of life expectancy, education, and per capita income.
Gorjani CO2 Emissions
Carbon Dioxide (CO2) Emissions Per Capita in Tonnes Per Year
| Location | CO2 Emissions | CO2 Emissions Per Capita | CO2 Emissions Intensity |
|---|---|---|---|
| Gorjani | 3,754 tn | 5.42 tn | 3,336.6 tons/km² |
| Osijek-Baranja County | 1,615,262 tn | 5.41 tn | 398.9 tons/km² |
| Croatia | 23,288,703 tn | 5.59 tn | 413.2 tons/km² |
| 2013 CO2 emissions (tonnes/year) | 3,754 tn |
| 2013 CO2 emissions (tonnes/year) per capita | 5.42 tn |
| 2013 CO2 emissions intensity (tonnes/km²/year) | 3,336.6 tons/km² |
Natural Hazards Risk
Relative risk out of 10
| Hazard | Risk Level |
|---|---|
| Flood | Medium (4) |
| Earthquake | Medium (4) |
* Risk, particularly concerning flood or landslide, may not be for the entire area.
- Dilley, M., R.S. Chen, U. Deichmann, A.L. Lerner-Lam, M. Arnold, J. Agwe, P. Buys, O. Kjekstad, B. Lyon, and G. Yetman. 2005. Natural Disaster Hotspots: A Global Risk Analysis. Washington, D.C.: World Bank. https://doi.org/10.1596/0-8213-5930-4.
- Center for Hazards and Risk Research - CHRR - Columbia University, Center for International Earth Science Information Network - CIESIN - Columbia University. 2005. Global Flood Hazard Frequency and Distribution. Palisades, NY: NASA Socioeconomic Data and Applications Center (SEDAC). https://doi.org/10.7927/H4668B3D.
- Center for Hazards and Risk Research - CHRR - Columbia University, Center for International Earth Science Information Network - CIESIN - Columbia University. 2005. Global Earthquake Hazard Distribution - Peak Ground Acceleration. Palisades, NY: NASA Socioeconomic Data and Applications Center (SEDAC). https://doi.org/10.7927/H4BZ63ZS.
Recent Nearby Earthquakes
Magnitude 3.0 and greater
| Date▼ | Time↕ | Magnitude↕ | Distance↕ | Depth↕ | Location↕ | Link |
|---|---|---|---|---|---|---|
| 7/21/19 | 7:05 AM | 4.2 | 78.9 km | 10,000 m | 4km WSW of Srebrenik, Bosnia and Herzegovina | usgs.gov |
| 10/7/16 | 9:25 AM | 4.4 | 15.1 km | 10,000 m | 1km NNW of Piskorevci, Croatia | usgs.gov |
| 8/18/11 | 1:17 AM | 3.6 | 93.1 km | 10,000 m | Bosnia and Herzegovina | usgs.gov |
| 5/8/08 | 6:12 PM | 4 | 11.6 km | 10,000 m | Croatia | usgs.gov |
| 2/11/08 | 4:27 AM | 3.1 | 98 km | 10,000 m | Bosnia and Herzegovina | usgs.gov |
| 8/21/06 | 10:49 AM | 4.1 | 79.8 km | 5,000 m | Bosnia and Herzegovina | usgs.gov |
| 10/10/04 | 4:11 AM | 3.1 | 81.7 km | 5,000 m | Bosnia and Herzegovina | usgs.gov |
| 7/16/04 | 10:18 PM | 3 | 81.8 km | 10,000 m | Bosnia and Herzegovina | usgs.gov |
| 5/18/04 | 9:33 PM | 3.1 | 36.6 km | 10,000 m | Croatia | usgs.gov |
| 7/23/03 | 9:47 AM | 3.2 | 82.4 km | 10,000 m | Bosnia and Herzegovina | usgs.gov |
Gorjani
Gorjani (Hungarian: Gara; German: Gerendau, Görrach) is a municipality in Osijek-Baranja County, Croatia. There are 1,550 inhabitants, 97% of whom are Croats (2011 census). Gorjani village was the seat of the House of Gorjanski (Garai, Garay).
Gorjani Wikipedia Page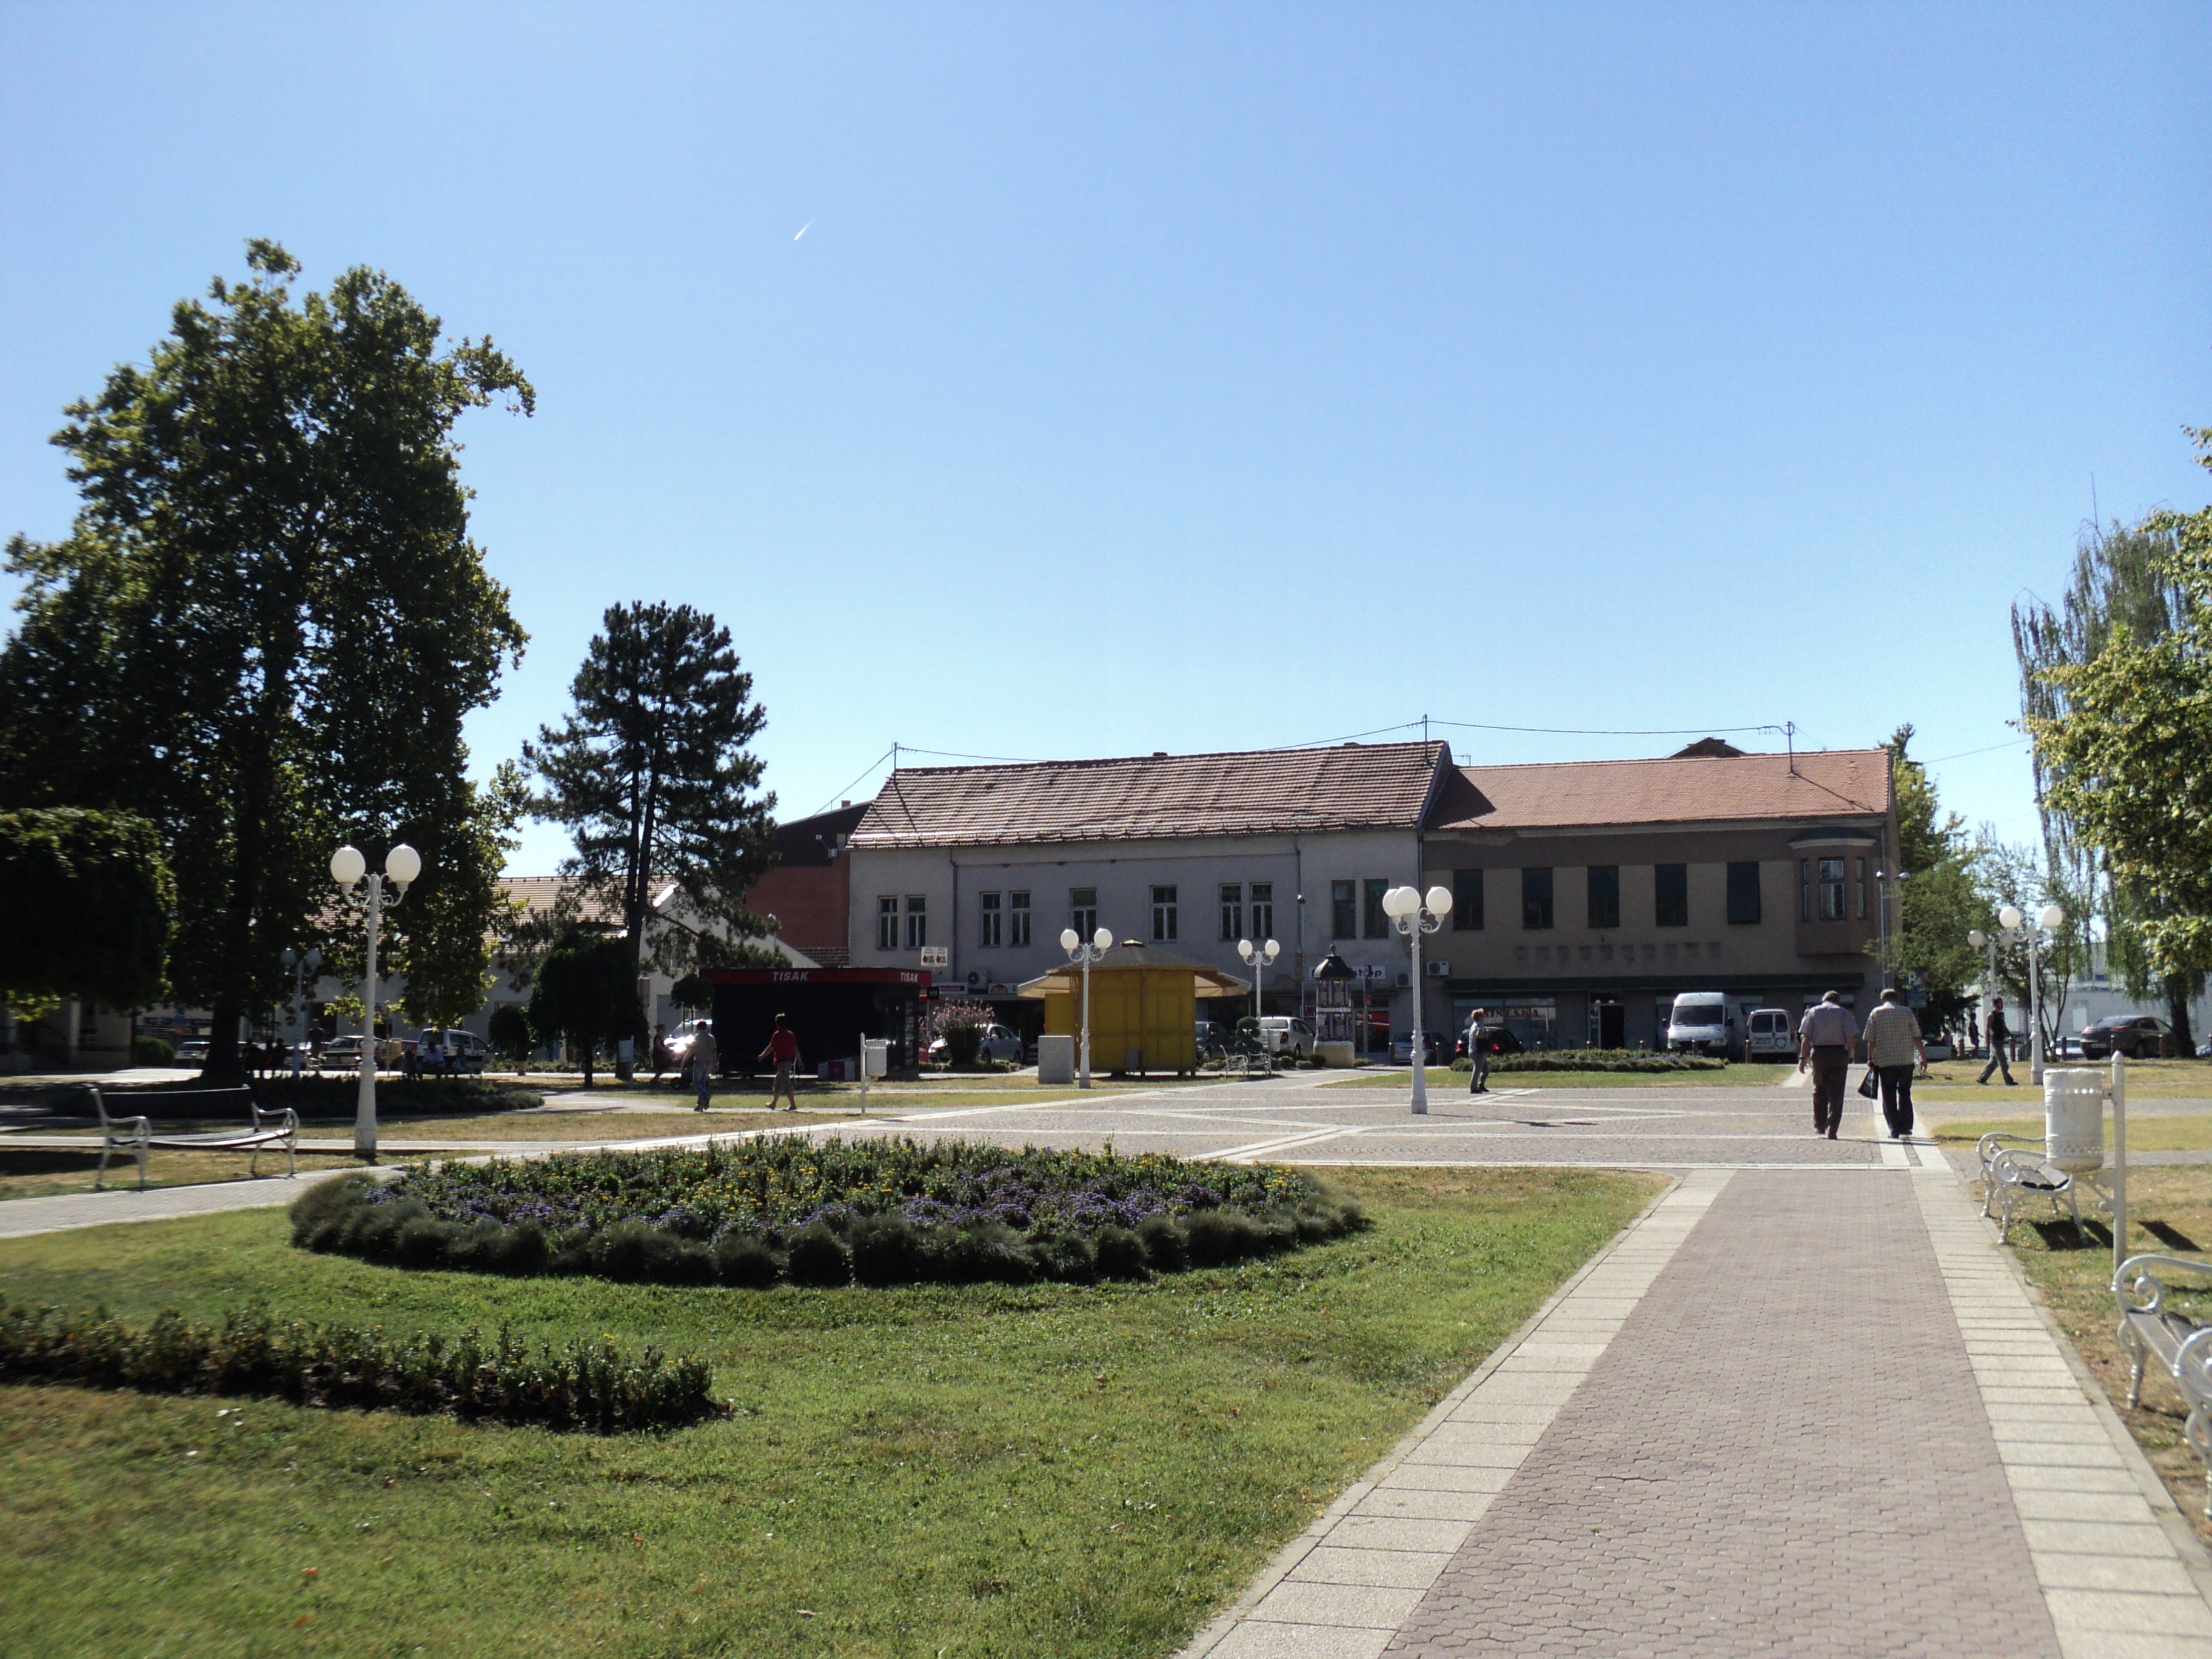


About Our Data
The data on this page is estimated using a number of publicly available tools and resources. It is provided without warranty, and could contain inaccuracies. Use at your own risk.