Categories in Novalja
Industries
Business Distribution by Industry in Novalja
| Industry Description | Number of Establishments | Average Google Rating |
|---|---|---|
| Other accommodation | 111 | 4.4 |
| Restaurants | 42 | 4.3 |
| Bars, pubs and taverns | 28 | 4.3 |
| Hotels and motels | 27 | 4.1 |
| Travel agencies | 20 | 4 |
| Holiday homes, cabins and resorts | 15 | 4.3 |
| Shopping | 15 | 3.8 |
| Sports and recreation | 13 | 4.8 |
| Campgrounds | 11 | 4.5 |
| Cafes | 11 | — |
| Hostels | 10 | 4.3 |
| All food and beverage | 10 | 4.1 |
| Real estate | 10 | 4.5 |
| Grocery stores and supermarkets | 9 | 4.1 |
| Loan companies | 8 | 4.3 |
| Mediterranean restaurants | 8 | 4.3 |
| Apartments | 8 | 4.4 |
| Dance clubs and discotheques | 7 | 4.4 |
| Travel and transportation | 6 | 3.5 |
| Atm's | 6 | 3.7 |
| Fast food restaurants | 6 | 4.1 |
| Banks | 6 | 4.2 |
| Pizza | 6 | 4.4 |
Novalja Facts
| Area | 2.1 km² |
| Population | 1,744 |
| Male Population | 884 (50.7%) |
| Female Population | 860 (49.3%) |
| Population change (1975 to 2020) | +45.1% |
| Population change (2000 to 2020) | +11.6% |
| Median Age | 45 years (Male: 43.8, Female: 46.5) |
| Neighborhoods | Isola di Pag |
| Local Time | |
| Timezone | Central European Summer Time |
| Lat & Lng | 44.55778, 14.88667 |
Map of Novalja
Interactive Map
Novalja Population
Years 1975 to 2020
| Data | 1975 | 1990 | 2000 | 2015 | 2020 |
|---|---|---|---|---|---|
| Population | 1,202 | 1,475 | 1,563 | 1,776 | 1,744 |
| Population Density | 582.8 / km² | 715.2 / km² | 757.8 / km² | 861.1 / km² | 845.6 / km² |
Novalja Population change from 2000 to 2015
Increase of 13.6% from year 2000 to 2015
| Location | Change since 1975 | Change since 1990 | Change since 2000 |
|---|---|---|---|
| Novalja | +47.8% | +20.4% | +13.6% |
| Lika-Senj County | -13.1% | -14.9% | -6.2% |
| Croatia | -6.1% | -11.4% | -4.3% |
Novalja Median Age
Median Age: 45 years
| Location | Median Age | Median Age (Female) | Median Age (Male) |
|---|---|---|---|
| Novalja | 45 yrs | 46.5 yrs | 43.8 yrs |
| Lika-Senj County | 46.5 yrs | 48.5 yrs | 44.9 yrs |
| Croatia | 42 yrs | 44.1 yrs | 40 yrs |
Novalja Population Density
Population Density: 846 / km²
| Location | Population | Area | Density |
|---|---|---|---|
| Novalja | 1,744 | 2.063 km² | 846 / km² |
| Lika-Senj County | 49,788 | 5,351.9 km² | 9.3 / km² |
| Croatia | 4.2 million | 56,366.2 km² | 73.9 / km² |
Novalja Historical and Projected Population
Estimated Population from 0 to 2100
- JRC (European Commission's Joint Research Centre) work on the GHS built-up grid
- CIESIN (Center for International Earth Science Information Network)
- [Link] Klein Goldewijk, K., Beusen, A., Doelman, J., and Stehfest, E.: Anthropogenic land use estimates for the Holocene – HYDE 3.2, Earth Syst. Sci. Data, 9, 927–953, https://doi.org/10.5194/essd-9-927-2017, 2017.
Area Codes
Percentage Area Codes used by businesses in Novalja
Price Distribution
Business distribution by price for Novalja
Human Development Index (HDI)
Statistic composite index of life expectancy, education, and per capita income.
Novalja CO2 Emissions
Carbon Dioxide (CO2) Emissions Per Capita in Tonnes Per Year
| Location | CO2 Emissions | CO2 Emissions Per Capita | CO2 Emissions Intensity |
|---|---|---|---|
| Novalja | 4,916 tn | 2.82 tn | 2,383.3 tons/km² |
| Lika-Senj County | 279,341 tn | 5.61 tn | 52.2 tons/km² |
| Croatia | 23,288,703 tn | 5.59 tn | 413.2 tons/km² |
| 2013 CO2 emissions (tonnes/year) | 4,916 tn |
| 2013 CO2 emissions (tonnes/year) per capita | 2.82 tn |
| 2013 CO2 emissions intensity (tonnes/km²/year) | 2,383.3 tons/km² |
Natural Hazards Risk
Relative risk out of 10
| Hazard | Risk Level |
|---|---|
| Flood | Medium (4) |
| Earthquake | Medium (4.3) |
* Risk, particularly concerning flood or landslide, may not be for the entire area.
- Dilley, M., R.S. Chen, U. Deichmann, A.L. Lerner-Lam, M. Arnold, J. Agwe, P. Buys, O. Kjekstad, B. Lyon, and G. Yetman. 2005. Natural Disaster Hotspots: A Global Risk Analysis. Washington, D.C.: World Bank. https://doi.org/10.1596/0-8213-5930-4.
- Center for Hazards and Risk Research - CHRR - Columbia University, Center for International Earth Science Information Network - CIESIN - Columbia University. 2005. Global Flood Hazard Frequency and Distribution. Palisades, NY: NASA Socioeconomic Data and Applications Center (SEDAC). https://doi.org/10.7927/H4668B3D.
- Center for Hazards and Risk Research - CHRR - Columbia University, Center for International Earth Science Information Network - CIESIN - Columbia University. 2005. Global Earthquake Hazard Distribution - Peak Ground Acceleration. Palisades, NY: NASA Socioeconomic Data and Applications Center (SEDAC). https://doi.org/10.7927/H4BZ63ZS.
Recent Nearby Earthquakes
Magnitude 3.0 and greater
| Date▼ | Time↕ | Magnitude↕ | Distance↕ | Depth↕ | Location↕ | Link |
|---|---|---|---|---|---|---|
| 8/8/17 | 9:35 AM | 4 | 75.1 km | 10,000 m | 3km E of Omisalj, Croatia | usgs.gov |
| 5/8/16 | 1:45 AM | 3.3 | 52.9 km | 6,280 m | 8km NNE of Otocac, Croatia | usgs.gov |
| 7/30/13 | 12:58 PM | 4.4 | 57.9 km | 11,100 m | 16km NNW of Brinje, Croatia | usgs.gov |
| 5/6/11 | 11:44 PM | 4 | 50.8 km | 9,000 m | Croatia | usgs.gov |
| 12/17/07 | 1:14 PM | 3.8 | 59.8 km | 10,000 m | Adriatic Sea | usgs.gov |
| 12/15/07 | 10:12 PM | 3 | 57.5 km | 10,000 m | Slovenia-Croatia border region | usgs.gov |
| 6/10/07 | 8:48 PM | 3.2 | 87 km | 10,000 m | Croatia | usgs.gov |
| 2/5/07 | 8:30 AM | 4.9 | 61 km | 10,000 m | Croatia | usgs.gov |
| 10/31/06 | 2:45 PM | 3.2 | 38.8 km | 10,000 m | Croatia | usgs.gov |
| 8/7/06 | 4:59 AM | 3 | 76.4 km | 10,000 m | Croatia | usgs.gov |
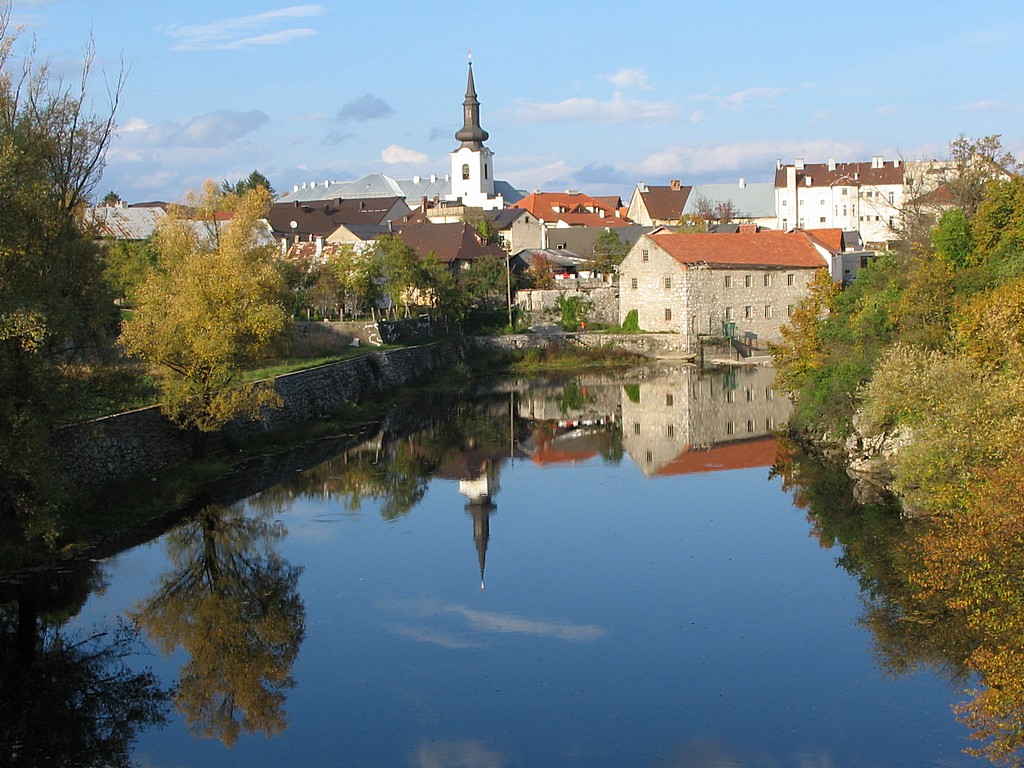
Novalja
Novalja (pronounced [nɔ̌v̞aʎa]) is a town in the north of the island of Pag in the Croatian part of Adriatic Sea. In recent times Novalja became famous because of the Zrće Beach, which is one of the biggest summer party zones in Europe.
Novalja Wikipedia Page


About Our Data
The data on this page is estimated using a number of publicly available tools and resources. It is provided without warranty, and could contain inaccuracies. Use at your own risk.