Categories in Bugyi
Industries
Business Distribution by Industry in Bugyi
| Industry Description | Number of Establishments |
|---|---|
| Grocery stores and supermarkets | 16 |
| All food and beverage | 15 |
| Corporate management | 15 |
| Freight/commercial transport | 13 |
| Construction of buildings | 10 |
| Shopping | 8 |
| Other transport activities | 8 |
| Public parks | 8 |
| Wholesalers | 7 |
| Restaurants | 7 |
| Health and medical | 7 |
| Bakeries | 6 |
| Fruits and vegetables | 6 |
Bugyi Facts
| Area | 3.5 km² |
| Population | 2,670 |
| Male Population | 1,283 (48.1%) |
| Female Population | 1,387 (51.9%) |
| Population change (1975 to 2020) | -36.9% |
| Population change (2000 to 2020) | -14.9% |
| Median Age | 41 years (Male: 39, Female: 42.8) |
| GDP per capita (PPP) | $26,986 (2022) |
| Neighborhoods | Újbuda, Kőbánya, Pesterzsébet |
| Local Time | |
| Timezone | Central European Summer Time |
| Lat & Lng | 47.22748, 19.14664 |
| Postal Codes | 2347 |
Map of Bugyi
Interactive Map
Bugyi Population
Years 1975 to 2030
| Data | 1975 | 1990 | 2000 | 2015 | 2020 | 2025* | 2030* |
|---|---|---|---|---|---|---|---|
| Population | 4,233 | 3,924 | 3,137 | 2,314 | 2,670 | 2,573 | 2,371 |
| Population Density | 1,209.4 / km² | 1,121.1 / km² | 896.3 / km² | 661.1 / km² | 762.9 / km² | 735.1 / km² | 677.4 / km² |
Bugyi Population change from 2000 to 2020
Decrease of 14.9% from year 2000 to 2020
| Location | Change since 1975 | Change since 1990 | Change since 2000 |
|---|---|---|---|
| Bugyi | -36.9% | -32% | -14.9% |
| Pest County | — | — | — |
| Hungary | — | — | — |
Bugyi Median Age
Median Age: 41 years
| Location | Median Age | Median Age (Female) | Median Age (Male) |
|---|---|---|---|
| Bugyi | 41 yrs | 42.8 yrs | 39 yrs |
| Pest County | 39.3 yrs | 40.9 yrs | 37.8 yrs |
| Hungary | 40.8 yrs | 43.2 yrs | 38.6 yrs |
Bugyi Population Density
Population Density: 763 / km²
| Location | Population | Area | Density |
|---|---|---|---|
| Bugyi | 2,670 | 3.5 km² | 763 / km² |
| Pest County | 1.2 million | 6,390.3 km² | 188 / km² |
| Hungary | 9.8 million | 93,010.9 km² | 106 / km² |
Bugyi Historical and Projected Population
Estimated Population from 0 to 2100
- JRC (European Commission's Joint Research Centre) work on the GHS built-up grid
- CIESIN (Center for International Earth Science Information Network)
- [Link] Klein Goldewijk, K., Beusen, A., Doelman, J., and Stehfest, E.: Anthropogenic land use estimates for the Holocene – HYDE 3.2, Earth Syst. Sci. Data, 9, 927–953, https://doi.org/10.5194/essd-9-927-2017, 2017.
Area Codes
Percentage Area Codes used by businesses in Bugyi
Price Distribution
Business distribution by price for Bugyi
Human Development Index (HDI)
Statistic composite index of life expectancy, education, and per capita income.
Bugyi Gross Domestic Product (GDP)
GDP per capita, PPP (constant 2017 international $)
| Data | 1990 | 1995 | 2000 | 2005 | 2010 | 2015 | 2020 | 2022 |
|---|---|---|---|---|---|---|---|---|
| GDP per capita | $16,986 | $16,993 | $28,279 | $22,419 | $20,297 | $22,862 | $24,571 | $26,986 |
| Total GDP | $264.4M | $269.9M | $453.4M | $368.4M | $347.7M | $400.6M | $428.7M | $472.2M |
Bugyi CO2 Emissions
Carbon Dioxide (CO2) Emissions Per Capita in Tonnes Per Year
| Location | CO2 Emissions | CO2 Emissions Per Capita | CO2 Emissions Intensity |
|---|---|---|---|
| Bugyi | 14,273 tn | 5.35 tn | 4,078 tons/km² |
| Pest County | 6,395,064 tn | 5.34 tn | 1,000.7 tons/km² |
| Hungary | 48,384,016 tn | 4.92 tn | 520.2 tons/km² |
| 2013 CO2 emissions (tonnes/year) | 14,273 tn |
| 2013 CO2 emissions (tonnes/year) per capita | 5.35 tn |
| 2013 CO2 emissions intensity (tonnes/km²/year) | 4,078 tons/km² |
Natural Hazards Risk
Relative risk out of 10
| Hazard | Risk Level |
|---|---|
| Earthquake | Medium (4) |
* Risk, particularly concerning flood or landslide, may not be for the entire area.
- Dilley, M., R.S. Chen, U. Deichmann, A.L. Lerner-Lam, M. Arnold, J. Agwe, P. Buys, O. Kjekstad, B. Lyon, and G. Yetman. 2005. Natural Disaster Hotspots: A Global Risk Analysis. Washington, D.C.: World Bank. https://doi.org/10.1596/0-8213-5930-4.
- Center for Hazards and Risk Research - CHRR - Columbia University, Center for International Earth Science Information Network - CIESIN - Columbia University. 2005. Global Earthquake Hazard Distribution - Peak Ground Acceleration. Palisades, NY: NASA Socioeconomic Data and Applications Center (SEDAC). https://doi.org/10.7927/H4BZ63ZS.
Recent Nearby Earthquakes
Magnitude 3.0 and greater
| Date▼ | Time↕ | Magnitude↕ | Distance↕ | Depth↕ | Location↕ | Link |
|---|---|---|---|---|---|---|
| 1/19/14 | 1:34 AM | 4 | 93 km | 3,100 m | 4km ESE of Balassagyarmat, Hungary | usgs.gov |
| 6/5/13 | 6:45 PM | 4.1 | 88.9 km | 6,200 m | 4km ENE of Ersekvadkert, Hungary | usgs.gov |
| 4/22/13 | 10:28 PM | 4.4 | 92.7 km | 13,000 m | 1km WNW of Heves, Hungary | usgs.gov |
| 1/29/11 | 5:41 PM | 4.3 | 70.2 km | 10,000 m | Hungary | usgs.gov |
| 12/31/06 | 1:39 PM | 4.1 | 28.8 km | 5,200 m | Hungary | usgs.gov |
| 9/15/06 | 9:02 PM | 3.1 | 53.8 km | 10,000 m | Hungary | usgs.gov |
| 6/21/03 | 8:05 PM | 3.8 | 64.2 km | 10,000 m | Hungary | usgs.gov |
| 10/23/02 | 2:52 AM | 4 | 83.2 km | 10,000 m | Hungary | usgs.gov |
| 10/12/02 | 6:49 PM | 3.4 | 73.7 km | 5,000 m | Hungary | usgs.gov |
| 6/28/01 | 7:08 AM | 3 | 77.5 km | 10,000 m | Hungary | usgs.gov |
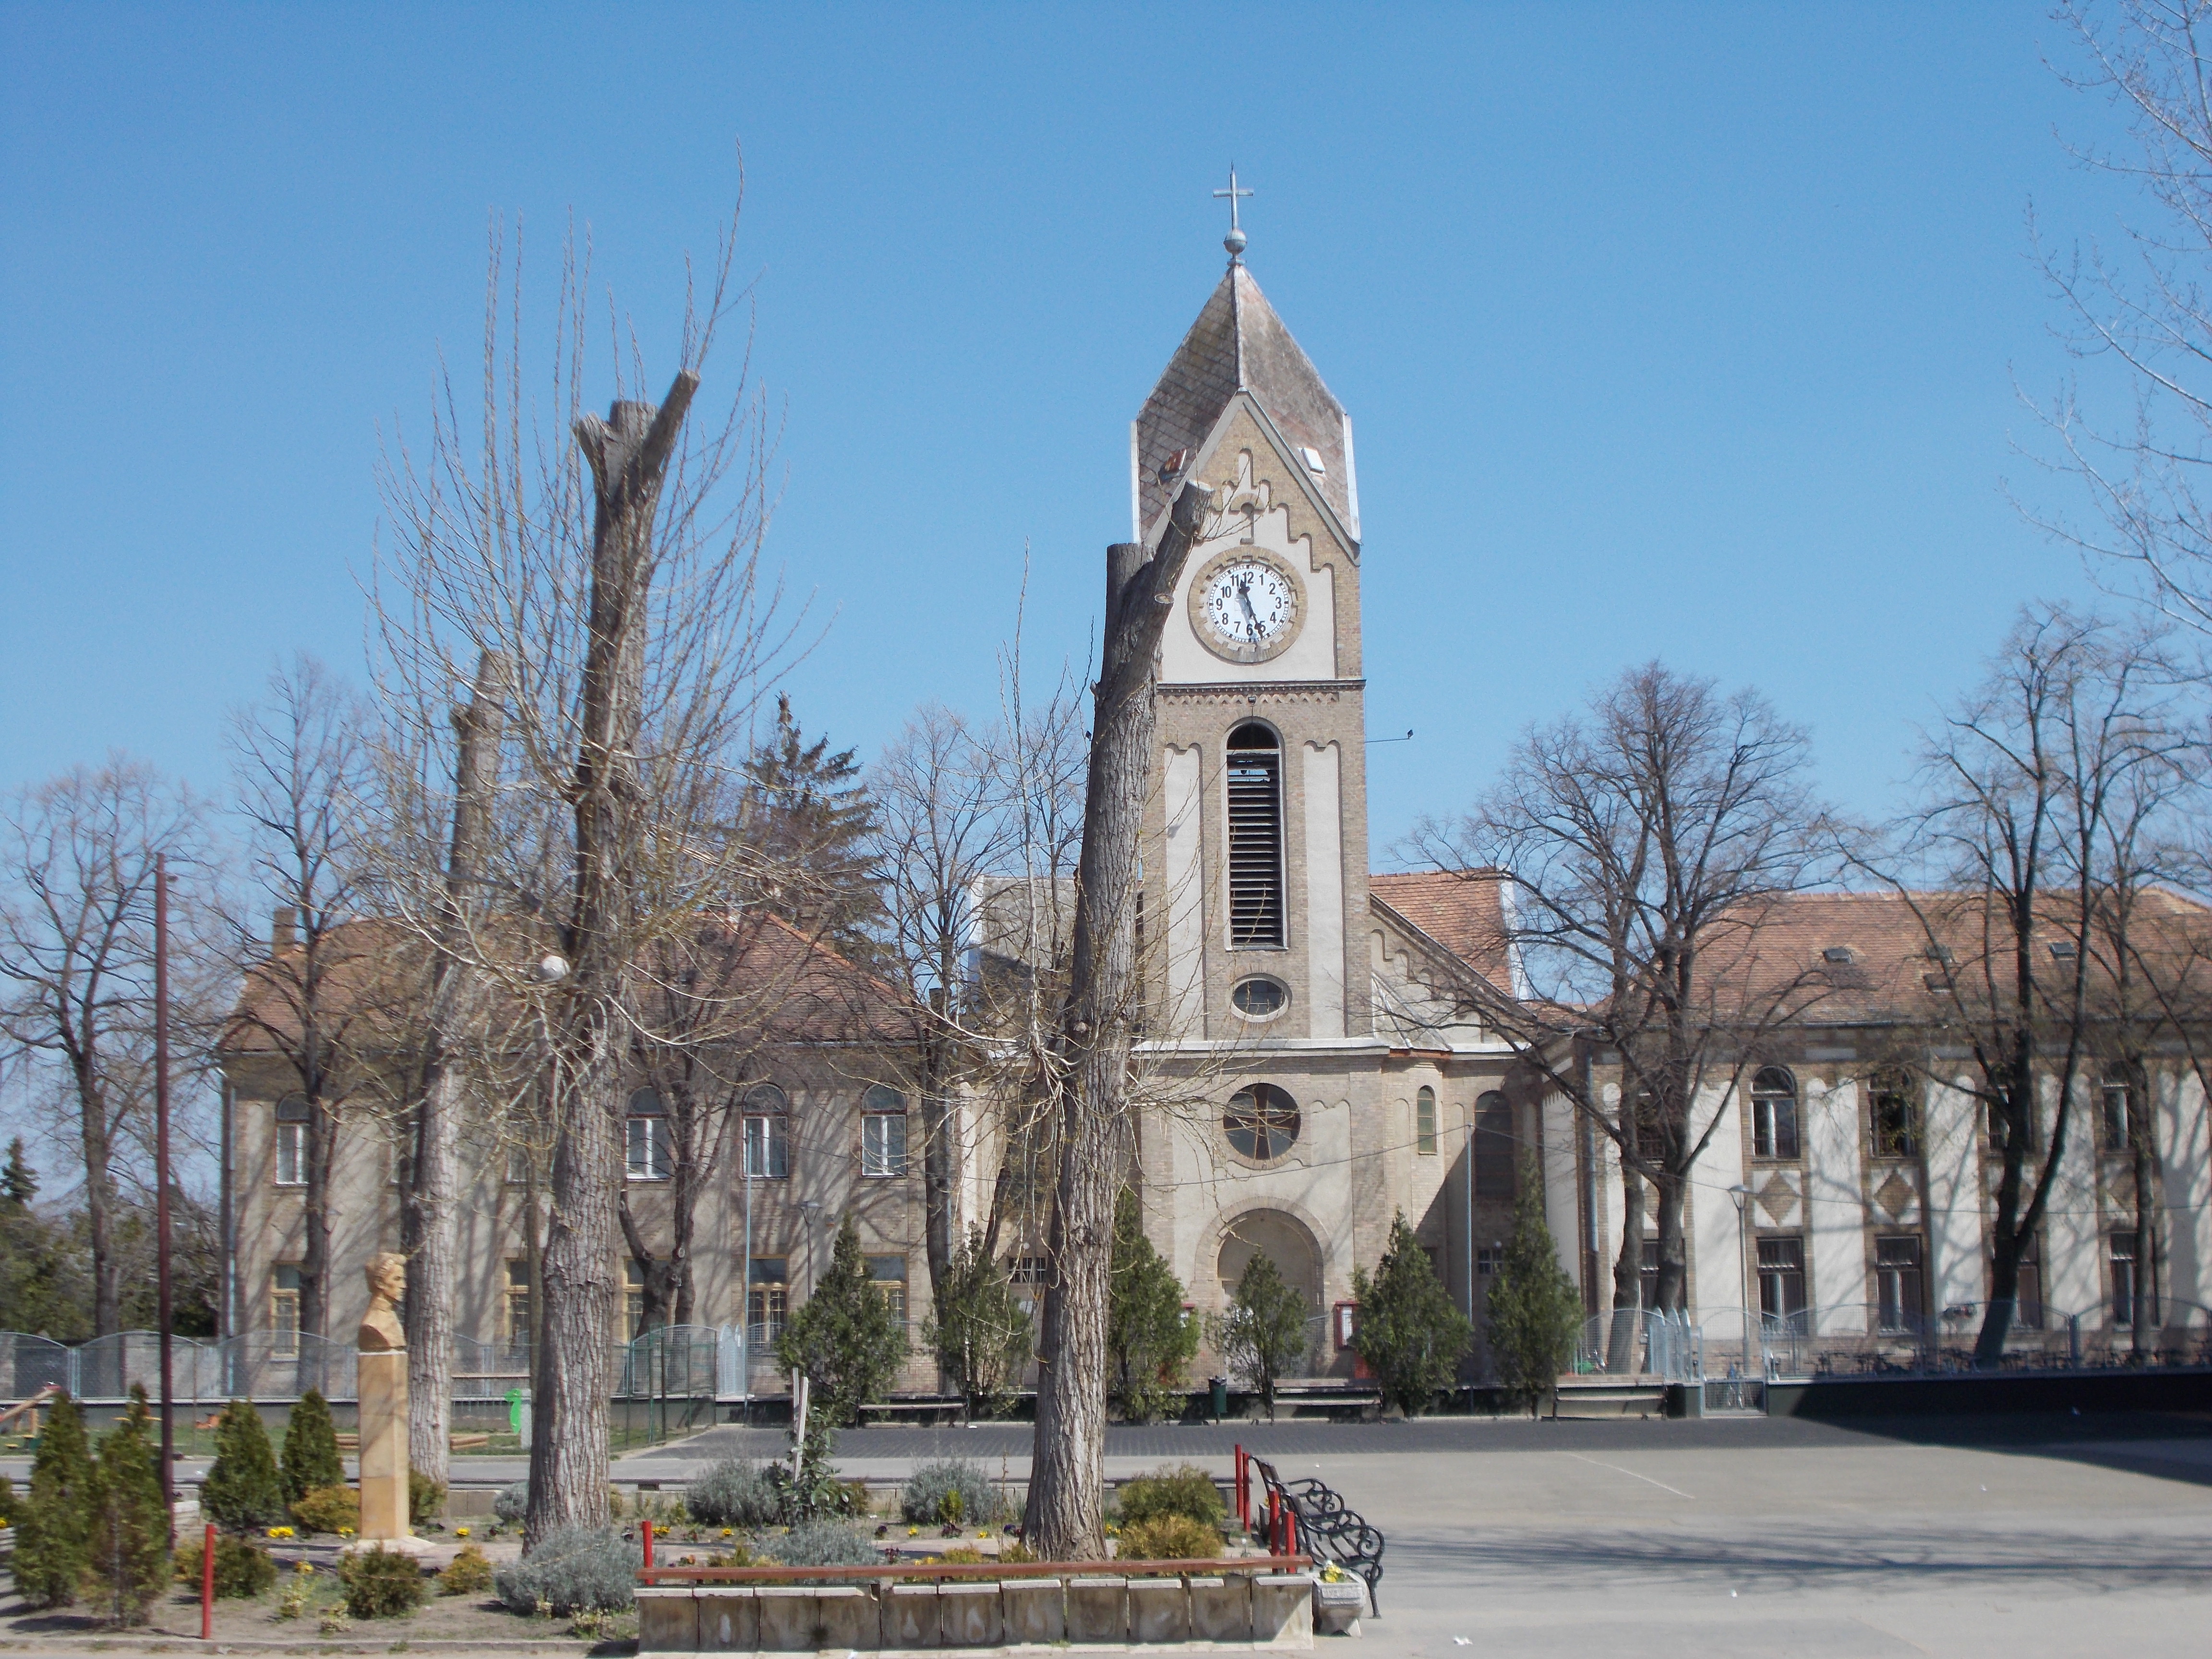
Bugyi
Bugyi is a village in Pest county, Hungary. Bugyi is a village of 5149 residents on 11558 hectares and about 30 km south from Budapest. It is located at the intersection of roads connecting Ócsa to Kiskunlacháza and Taksony to Dabas and Kunpeszér, bu..
Bugyi Wikipedia Page

About Our Data
The data on this page is estimated using a number of publicly available tools and resources. It is provided without warranty, and could contain inaccuracies. Use at your own risk.