Categories in Bonjol
Bonjol Facts
| Area | 8.6 km² |
| Population | 1,216 |
| Male Population | 601 (49.4%) |
| Female Population | 615 (50.6%) |
| Population change (1975 to 2020) | +164.9% |
| Population change (2000 to 2020) | +44.9% |
| Median Age | 24.2 years (Male: 23.2, Female: 25.2) |
| Local Time | |
| Timezone | Western Indonesia Time |
| Lat & Lng | -0.01785, 100.22748 |
| Postal Codes | 26382 |
Map of Bonjol
Interactive Map
Bonjol Population
Years 1975 to 2020
| Data | 1975 | 1990 | 2000 | 2015 | 2020 |
|---|---|---|---|---|---|
| Population | 459 | 705 | 839 | 1,173 | 1,216 |
| Population Density | 53.6 / km² | 82.3 / km² | 98 / km² | 137 / km² | 142 / km² |
Bonjol Population change from 2000 to 2015
Increase of 39.8% from year 2000 to 2015
| Location | Change since 1975 | Change since 1990 | Change since 2000 |
|---|---|---|---|
| Bonjol | +155.6% | +66.4% | +39.8% |
| West Sumatra | +41.3% | +6.7% | +3.3% |
| Indonesia | +96.9% | +41.9% | +21.7% |
Bonjol Median Age
Median Age: 24.2 years
| Location | Median Age | Median Age (Female) | Median Age (Male) |
|---|---|---|---|
| Bonjol | 24.2 yrs | 25.2 yrs | 23.2 yrs |
| West Sumatra | 26.8 yrs | 28.2 yrs | 25.4 yrs |
| Indonesia | 27.2 yrs | 27.5 yrs | 26.9 yrs |
Bonjol Population Density
Population Density: 142 / km²
| Location | Population | Area | Density |
|---|---|---|---|
| Bonjol | 1,216 | 8.6 km² | 142 / km² |
| West Sumatra | 21,004 | 50.2 km² | 419 / km² |
| Indonesia | 252.8 million | 1,893,657.8 km² | 134 / km² |
Bonjol Historical and Projected Population
Estimated Population from 1200 to 2100
- JRC (European Commission's Joint Research Centre) work on the GHS built-up grid
- CIESIN (Center for International Earth Science Information Network)
- [Link] Klein Goldewijk, K., Beusen, A., Doelman, J., and Stehfest, E.: Anthropogenic land use estimates for the Holocene – HYDE 3.2, Earth Syst. Sci. Data, 9, 927–953, https://doi.org/10.5194/essd-9-927-2017, 2017.
Price Distribution
Business distribution by price for Bonjol
Human Development Index (HDI)
Statistic composite index of life expectancy, education, and per capita income.
Bonjol CO2 Emissions
Carbon Dioxide (CO2) Emissions Per Capita in Tonnes Per Year
| Location | CO2 Emissions | CO2 Emissions Per Capita | CO2 Emissions Intensity |
|---|---|---|---|
| Bonjol | 2,369 tn | 1.95 tn | 276.7 tons/km² |
| West Sumatra | 39,808 tn | 1.9 tn | 793.7 tons/km² |
| Indonesia | 478,610,416 tn | 1.89 tn | 252.7 tons/km² |
| 2013 CO2 emissions (tonnes/year) | 2,369 tn |
| 2013 CO2 emissions (tonnes/year) per capita | 1.95 tn |
| 2013 CO2 emissions intensity (tonnes/km²/year) | 276.7 tons/km² |
Natural Hazards Risk
Relative risk out of 10
| Hazard | Risk Level |
|---|---|
| Drought | Low (2) |
| Flood | High (8) |
| Earthquake | Medium (6) |
| Landslide | High (8) |
* Risk, particularly concerning flood or landslide, may not be for the entire area.
- Dilley, M., R.S. Chen, U. Deichmann, A.L. Lerner-Lam, M. Arnold, J. Agwe, P. Buys, O. Kjekstad, B. Lyon, and G. Yetman. 2005. Natural Disaster Hotspots: A Global Risk Analysis. Washington, D.C.: World Bank. https://doi.org/10.1596/0-8213-5930-4.
- Center for Hazards and Risk Research - CHRR - Columbia University, Center for International Earth Science Information Network - CIESIN - Columbia University, and Norwegian Geotechnical Institute - NGI. 2005. Global Landslide Hazard Distribution. Palisades, NY: NASA Socioeconomic Data and Applications Center (SEDAC). https://doi.org/10.7927/H4P848VZ.
- Center for Hazards and Risk Research - CHRR - Columbia University, Center for International Earth Science Information Network - CIESIN - Columbia University, and International Research Institute for Climate and Society - IRI - Columbia University. 2005. Global Drought Hazard Frequency and Distribution. Palisades, NY: NASA Socioeconomic Data and Applications Center (SEDAC). https://doi.org/10.7927/H4VX0DFT.
- Center for Hazards and Risk Research - CHRR - Columbia University, Center for International Earth Science Information Network - CIESIN - Columbia University. 2005. Global Flood Hazard Frequency and Distribution. Palisades, NY: NASA Socioeconomic Data and Applications Center (SEDAC). https://doi.org/10.7927/H4668B3D.
- Center for Hazards and Risk Research - CHRR - Columbia University, Center for International Earth Science Information Network - CIESIN - Columbia University. 2005. Global Earthquake Hazard Distribution - Peak Ground Acceleration. Palisades, NY: NASA Socioeconomic Data and Applications Center (SEDAC). https://doi.org/10.7927/H4BZ63ZS.
Recent Nearby Earthquakes
Magnitude 3.0 and greater
| Date▼ | Time↕ | Magnitude↕ | Distance↕ | Depth↕ | Location↕ | Link |
|---|---|---|---|---|---|---|
| 3/19/19 | 6:17 PM | 4.3 | 43.2 km | 61,430 m | 4km ESE of Kotatua, Indonesia | usgs.gov |
| 12/23/18 | 2:03 PM | 5 | 74.9 km | 98,030 m | 23km WSW of Tiku, Indonesia | usgs.gov |
| 5/28/18 | 7:27 AM | 4.3 | 69.6 km | 162,320 m | 69km NNW of Bonjol, Indonesia | usgs.gov |
| 10/15/17 | 2:26 PM | 4 | 71.3 km | 177,130 m | 71km NNW of Bonjol, Indonesia | usgs.gov |
| 4/2/17 | 12:59 PM | 4 | 68.4 km | 140,910 m | 68km NW of Bonjol, Indonesia | usgs.gov |
| 2/15/17 | 5:33 PM | 4.5 | 77.7 km | 153,290 m | 77km NW of Bonjol, Indonesia | usgs.gov |
| 9/29/16 | 11:05 PM | 4.2 | 64.1 km | 181,770 m | 64km N of Bonjol, Indonesia | usgs.gov |
| 9/21/16 | 4:50 PM | 4.1 | 52.7 km | 162,500 m | 52km NNW of Bonjol, Indonesia | usgs.gov |
| 8/22/16 | 5:36 AM | 4.2 | 68.3 km | 154,810 m | 68km NW of Bonjol, Indonesia | usgs.gov |
| 7/10/16 | 9:31 AM | 5.1 | 16.2 km | 8,070 m | 16km WNW of Bonjol, Indonesia | usgs.gov |
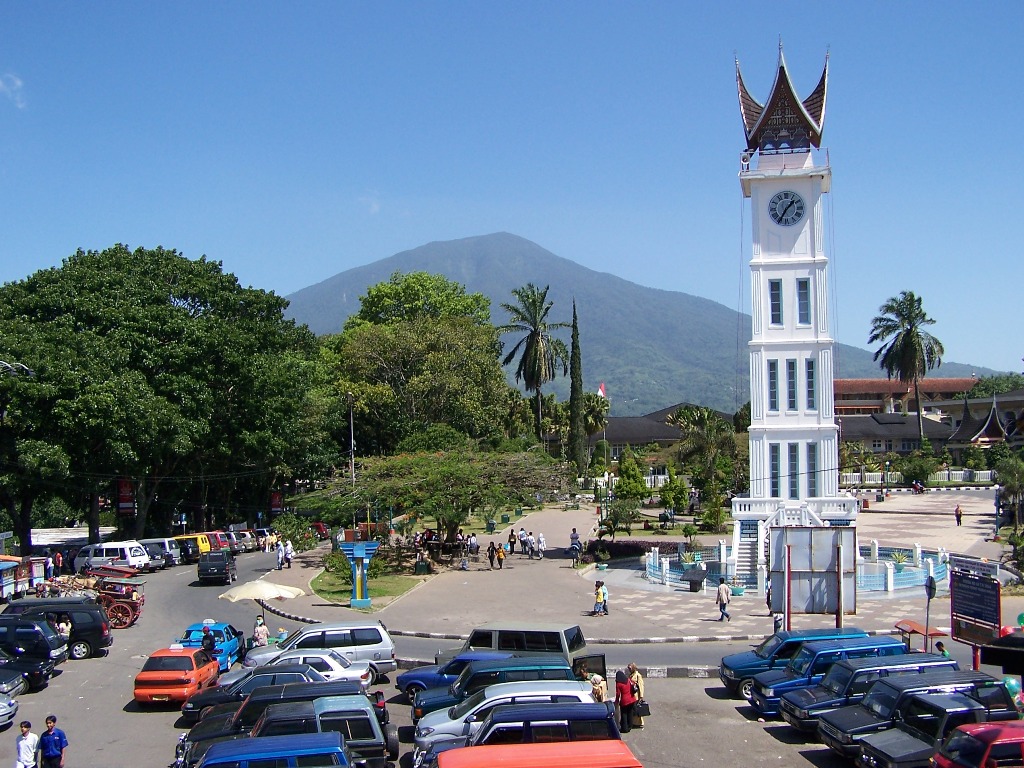
Bonjol
Bonjol is name of a subdistrict (kecamatan) in the Pasaman Regency (kabupaten Pasaman), province West Sumatera, Indonesia. It is famous especially for its location as it lies just at the equator line. Bonjol is also the place of birth of Tuanku Imam ..
Bonjol Wikipedia Page

About Our Data
The data on this page is estimated using a number of publicly available tools and resources. It is provided without warranty, and could contain inaccuracies. Use at your own risk.