'Ara Facts
| Area | 1.5 km² |
| Population | 6,149 |
| Male Population | 3,118 (50.7%) |
| Female Population | 3,031 (49.3%) |
| Population change (1975 to 2020) | +187.5% |
| Population change (2000 to 2020) | +56.1% |
| Median Age | 21.3 years (Male: 20.7, Female: 22) |
| Local Time | |
| Timezone | Israel Daylight Time |
| Lat & Lng | 32.50368, 35.07984 |
Map of 'Ara
Interactive Map
'Ara Population
Years 1975 to 2020
| Data | 1975 | 1990 | 2000 | 2015 | 2020 |
|---|---|---|---|---|---|
| Population | 2,139 | 3,084 | 3,938 | 5,544 | 6,149 |
| Population Density | 1,426 / km² | 2,056 / km² | 2,625.3 / km² | 3,696 / km² | 4,099.3 / km² |
'Ara Population change from 2000 to 2015
Increase of 40.8% from year 2000 to 2015
| Location | Change since 1975 | Change since 1990 | Change since 2000 |
|---|---|---|---|
| 'Ara | +159.2% | +79.8% | +40.8% |
| Haifa District | +73.2% | +47.5% | +19.9% |
| Israel | +141.5% | +78.8% | +33.8% |
'Ara Median Age
Median Age: 21.3 years
| Location | Median Age | Median Age (Female) | Median Age (Male) |
|---|---|---|---|
| 'Ara | 21.3 yrs | 22 yrs | 20.7 yrs |
| Haifa District | 32.3 yrs | 33.9 yrs | 30.7 yrs |
| Israel | 29.5 yrs | 30.6 yrs | 28.5 yrs |
'Ara Population Density
Population Density: 4,099 / km²
| Location | Population | Area | Density |
|---|---|---|---|
| 'Ara | 6,149 | 1.5 km² | 4,099 / km² |
| Haifa District | 942,781 | 865.4 km² | 1,089 / km² |
| Israel | 8.3 million | 22,078 km² | 374 / km² |
'Ara Historical and Projected Population
Estimated Population from 0 to 2100
- JRC (European Commission's Joint Research Centre) work on the GHS built-up grid
- CIESIN (Center for International Earth Science Information Network)
- [Link] Klein Goldewijk, K., Beusen, A., Doelman, J., and Stehfest, E.: Anthropogenic land use estimates for the Holocene – HYDE 3.2, Earth Syst. Sci. Data, 9, 927–953, https://doi.org/10.5194/essd-9-927-2017, 2017.
Human Development Index (HDI)
Statistic composite index of life expectancy, education, and per capita income.
'Ara CO2 Emissions
Carbon Dioxide (CO2) Emissions Per Capita in Tonnes Per Year
| Location | CO2 Emissions | CO2 Emissions Per Capita | CO2 Emissions Intensity |
|---|---|---|---|
| 'Ara | 66,449 tn | 10.81 tn | 44,299.6 tons/km² |
| Haifa District | 10,045,714 tn | 10.66 tn | 11,608.3 tons/km² |
| Israel | 81,985,471 tn | 9.92 tn | 3,713.4 tons/km² |
| 2013 CO2 emissions (tonnes/year) | 66,449 tn |
| 2013 CO2 emissions (tonnes/year) per capita | 10.81 tn |
| 2013 CO2 emissions intensity (tonnes/km²/year) | 44,299.6 tons/km² |
Natural Hazards Risk
Relative risk out of 10
| Hazard | Risk Level |
|---|---|
| Drought | High (9) |
| Flood | Medium (7) |
| Earthquake | Medium (7) |
* Risk, particularly concerning flood or landslide, may not be for the entire area.
- Dilley, M., R.S. Chen, U. Deichmann, A.L. Lerner-Lam, M. Arnold, J. Agwe, P. Buys, O. Kjekstad, B. Lyon, and G. Yetman. 2005. Natural Disaster Hotspots: A Global Risk Analysis. Washington, D.C.: World Bank. https://doi.org/10.1596/0-8213-5930-4.
- Center for Hazards and Risk Research - CHRR - Columbia University, Center for International Earth Science Information Network - CIESIN - Columbia University, and International Research Institute for Climate and Society - IRI - Columbia University. 2005. Global Drought Hazard Frequency and Distribution. Palisades, NY: NASA Socioeconomic Data and Applications Center (SEDAC). https://doi.org/10.7927/H4VX0DFT.
- Center for Hazards and Risk Research - CHRR - Columbia University, Center for International Earth Science Information Network - CIESIN - Columbia University. 2005. Global Flood Hazard Frequency and Distribution. Palisades, NY: NASA Socioeconomic Data and Applications Center (SEDAC). https://doi.org/10.7927/H4668B3D.
- Center for Hazards and Risk Research - CHRR - Columbia University, Center for International Earth Science Information Network - CIESIN - Columbia University. 2005. Global Earthquake Hazard Distribution - Peak Ground Acceleration. Palisades, NY: NASA Socioeconomic Data and Applications Center (SEDAC). https://doi.org/10.7927/H4BZ63ZS.
Recent Nearby Earthquakes
Magnitude 3.0 and greater
| Date▼ | Time↕ | Magnitude↕ | Distance↕ | Depth↕ | Location↕ | Link |
|---|---|---|---|---|---|---|
| 7/4/18 | 7:45 PM | 4.7 | 47.2 km | 10,000 m | 5km SE of 'Eilabun, Israel | usgs.gov |
| 7/4/18 | 1:50 AM | 4 | 45.8 km | 10,000 m | 6km SSE of 'Eilabun, Israel | usgs.gov |
| 10/20/13 | 12:54 PM | 3.5 | 60.5 km | 5,000 m | 8km NNE of Tiberias, Israel | usgs.gov |
| 8/7/11 | 8:52 AM | 4.1 | 57.7 km | 31,000 m | Dead Sea region | usgs.gov |
| 7/10/09 | 6:19 PM | 4 | 92.3 km | 10,000 m | Lebanon - Syria region | usgs.gov |
| 8/13/08 | 6:05 AM | 3.2 | 78.3 km | 10,000 m | eastern Mediterranean Sea | usgs.gov |
| 6/23/08 | 3:45 PM | 3 | 93.2 km | 1,000 m | Lebanon - Syria region | usgs.gov |
| 6/13/08 | 5:28 AM | 4 | 96.9 km | 1,000 m | Lebanon - Syria region | usgs.gov |
| 6/12/08 | 4:40 PM | 4 | 97.6 km | 5,400 m | Lebanon - Syria region | usgs.gov |
| 6/12/08 | 3:43 PM | 3.9 | 93.8 km | 4,300 m | Lebanon - Syria region | usgs.gov |
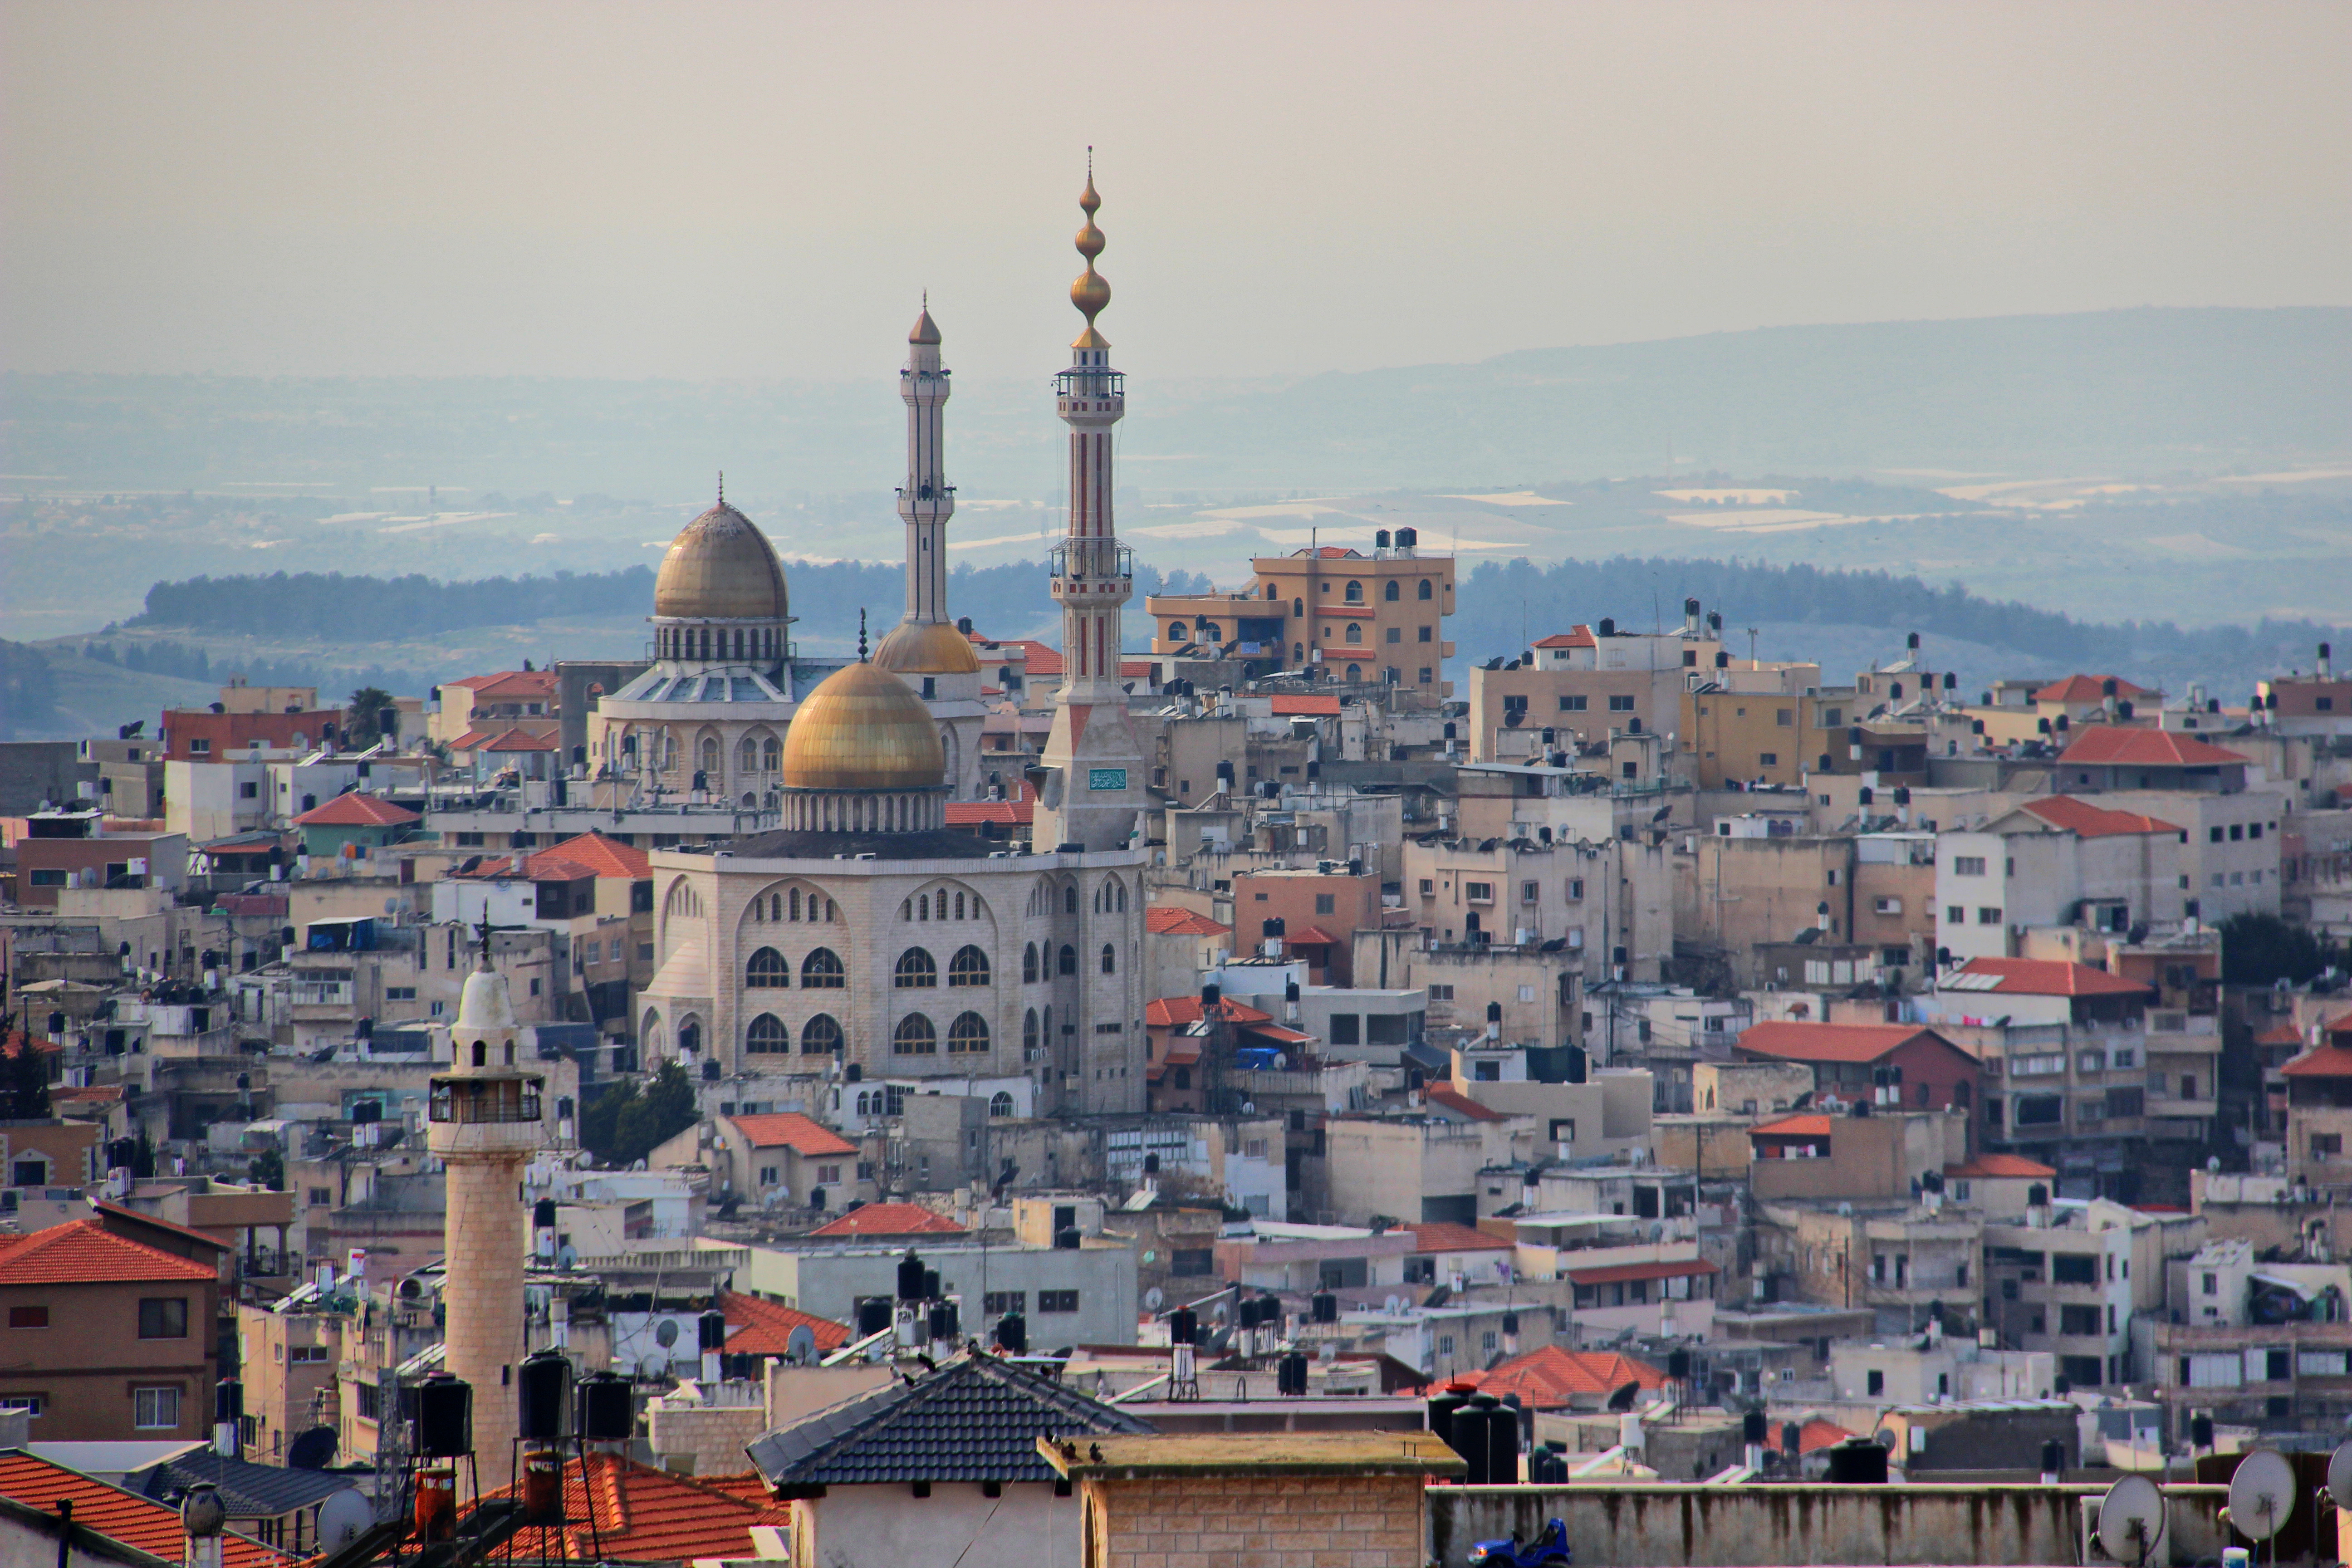
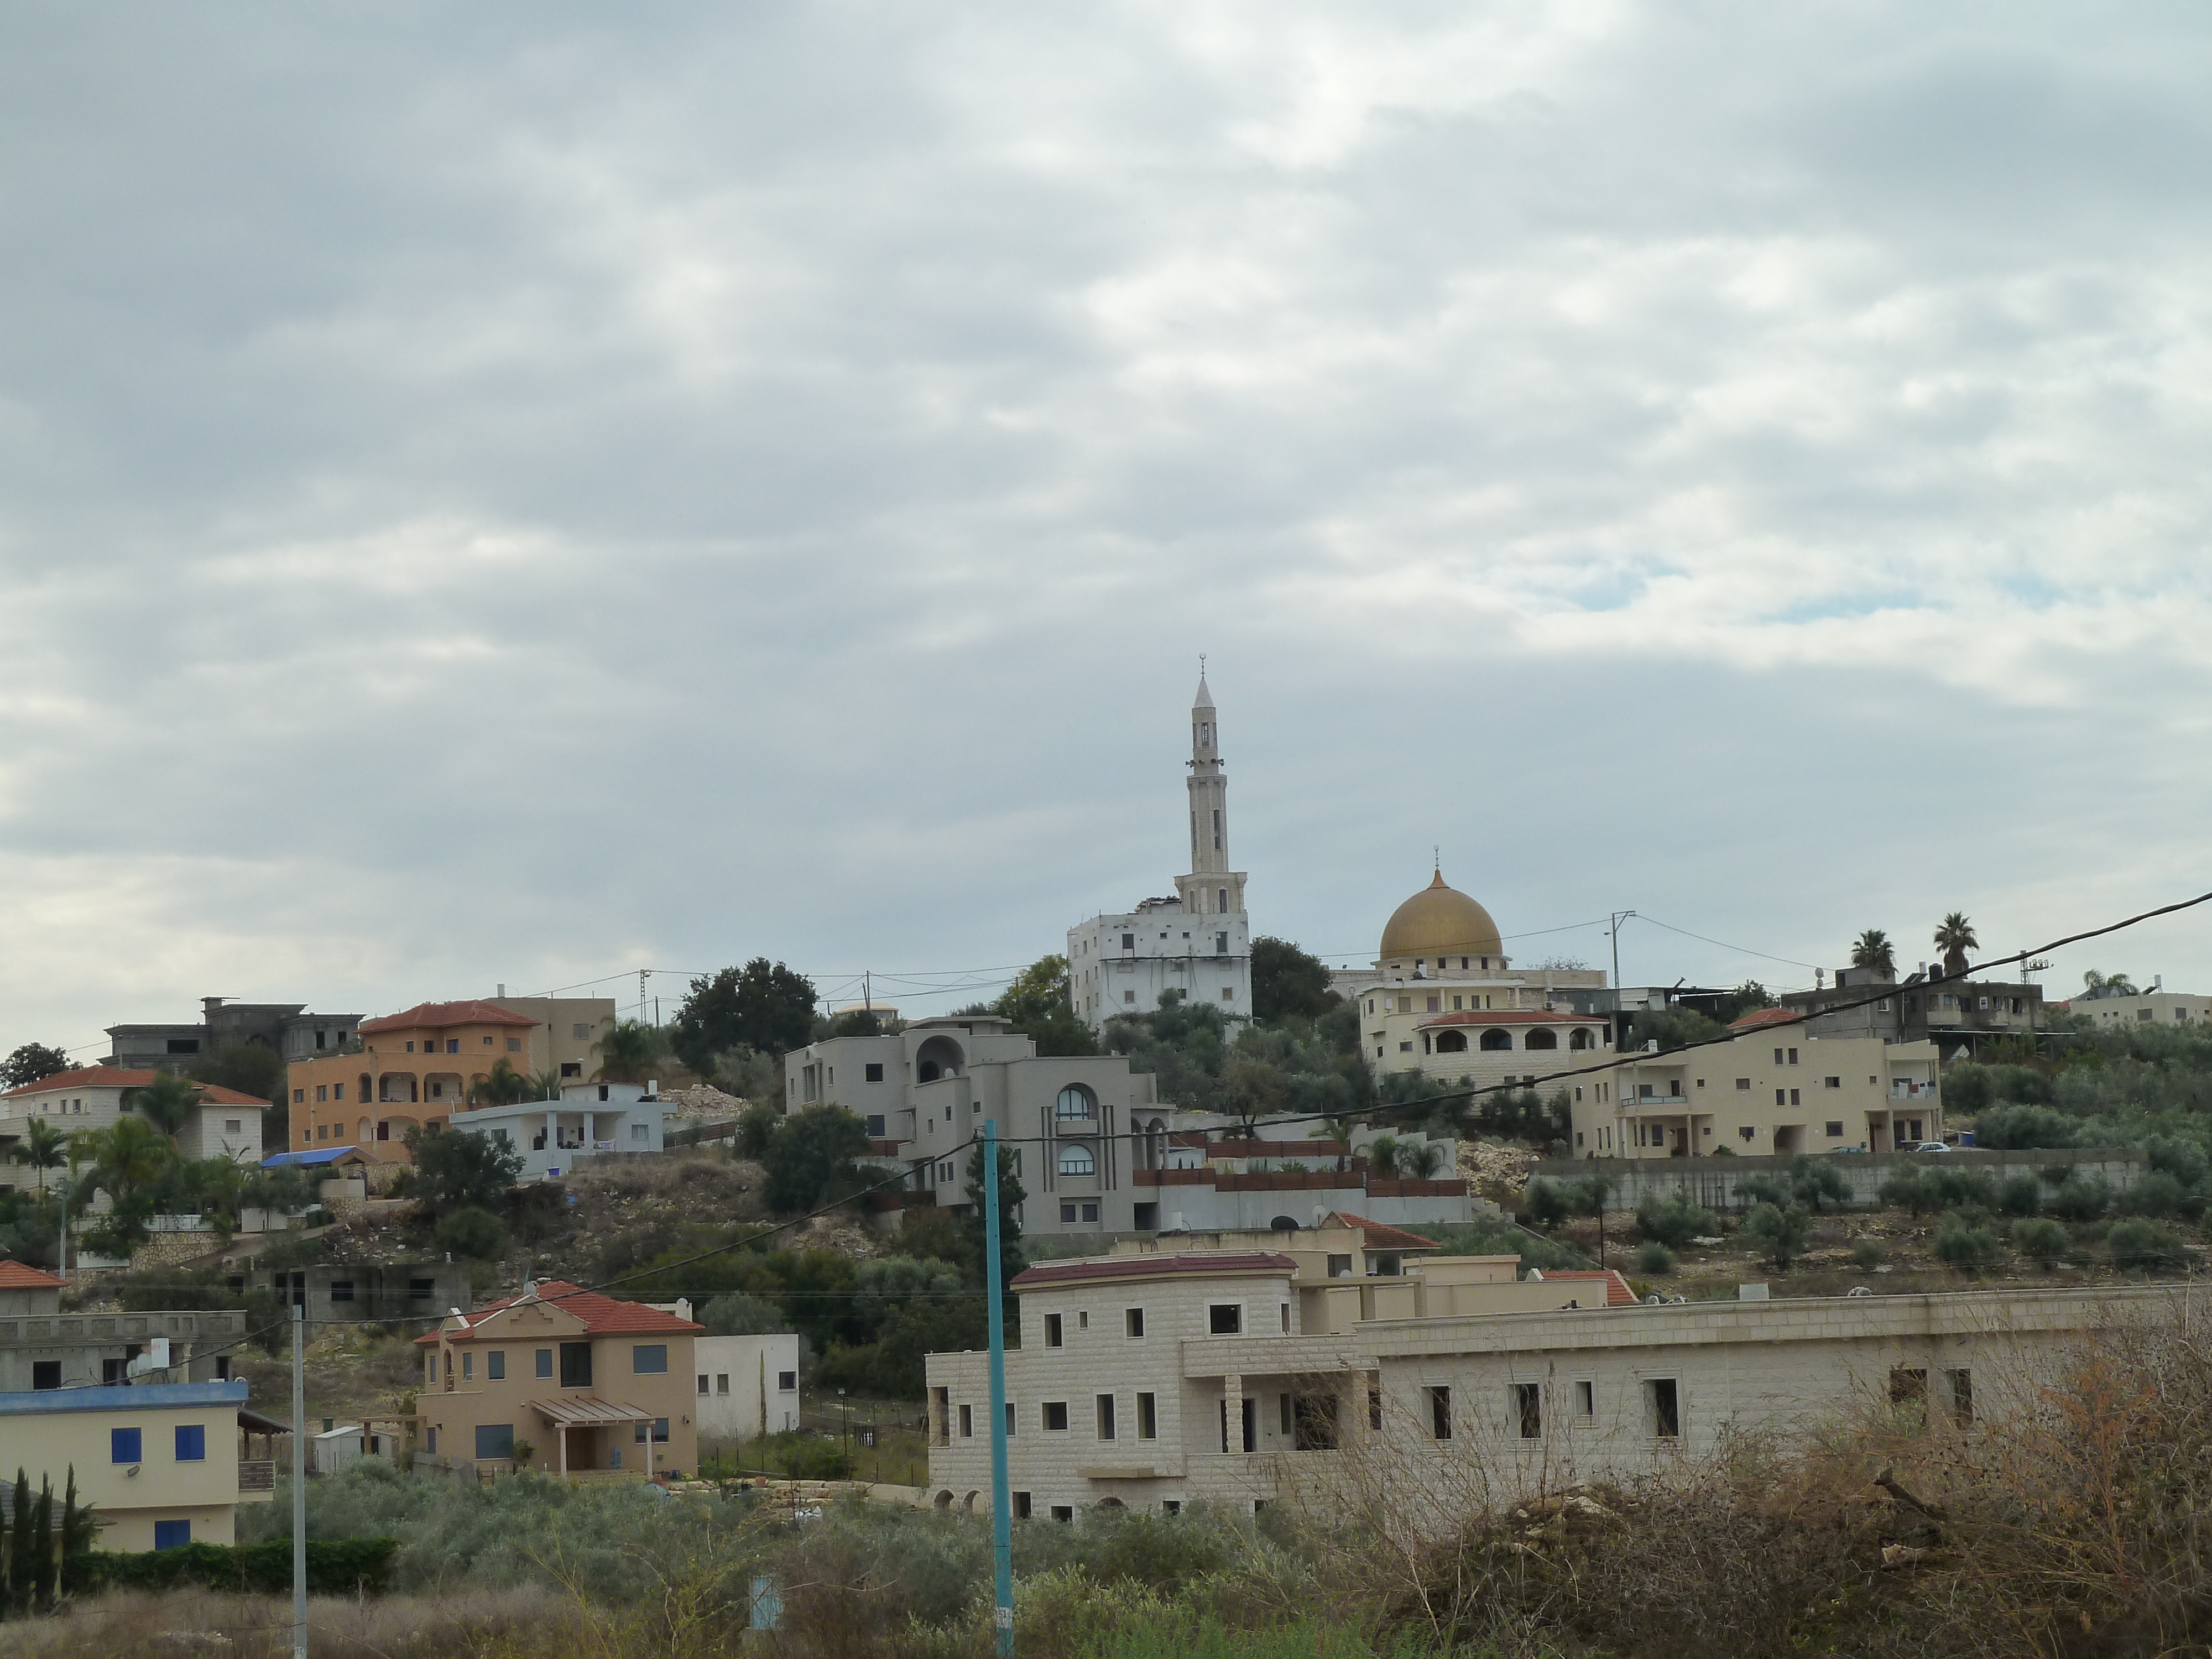
'Ara
'Ara (Hebrew: עָרָה; Arabic: عاره) is a village in the Haifa District in northern Israel, located in the Wadi Ara valley. Since 1985 'Ara has been part of the Ar'ara local council. It is north of highway 65, between Ar'ara and Kfar Qara. Its populat..
'Ara Wikipedia Page
About Our Data
The data on this page is estimated using a number of publicly available tools and resources. It is provided without warranty, and could contain inaccuracies. Use at your own risk.