Manshiya Facts
| Area | 0.2 km² |
| Population | 169 |
| Male Population | 82 (48.6%) |
| Female Population | 87 (51.4%) |
| Population change (1975 to 2020) | +2716.7% |
| Population change (2000 to 2020) | +43.2% |
| Median Age | 34.6 years (Male: 33.9, Female: 35.6) |
| Local Time | |
| Timezone | Israel Daylight Time |
| Lat & Lng | 32.06435, 34.76282 |
| Postal Codes | 68018 |
Map of Manshiya
Interactive Map
Manshiya Population
Years 1975 to 2020
| Data | 1975 | 1990 | 2000 | 2015 | 2020 |
|---|---|---|---|---|---|
| Population | 6 | 89 | 118 | 153 | 169 |
| Population Density | 32 / km² | 474.7 / km² | 629.3 / km² | 816 / km² | 901.3 / km² |
Manshiya Population change from 2000 to 2015
Increase of 29.7% from year 2000 to 2015
| Location | Change since 1975 | Change since 1990 | Change since 2000 |
|---|---|---|---|
| Manshiya | +2450% | +71.9% | +29.7% |
| Tel Aviv District | +93.2% | +53.9% | +22% |
| Israel | +141.5% | +78.8% | +33.8% |
Manshiya Median Age
Median Age: 34.6 years
| Location | Median Age | Median Age (Female) | Median Age (Male) |
|---|---|---|---|
| Manshiya | 34.6 yrs | 35.6 yrs | 33.9 yrs |
| Tel Aviv District | 34 yrs | 35.2 yrs | 32.8 yrs |
| Israel | 29.5 yrs | 30.6 yrs | 28.5 yrs |
Manshiya Population Density
Population Density: 901 / km²
| Location | Population | Area | Density |
|---|---|---|---|
| Manshiya | 169 | 0.188 km² | 901 / km² |
| Tel Aviv District | 1.4 million | 172.1 km² | 7,855 / km² |
| Israel | 8.3 million | 22,078 km² | 374 / km² |
Manshiya Historical and Projected Population
Estimated Population from 300 to 2100
- JRC (European Commission's Joint Research Centre) work on the GHS built-up grid
- CIESIN (Center for International Earth Science Information Network)
- [Link] Klein Goldewijk, K., Beusen, A., Doelman, J., and Stehfest, E.: Anthropogenic land use estimates for the Holocene – HYDE 3.2, Earth Syst. Sci. Data, 9, 927–953, https://doi.org/10.5194/essd-9-927-2017, 2017.
Human Development Index (HDI)
Statistic composite index of life expectancy, education, and per capita income.
Tel Aviv District CO2 Emissions
Carbon Dioxide (CO2) Emissions Per Capita in Tonnes Per Year
| Location | CO2 Emissions | CO2 Emissions Per Capita | CO2 Emissions Intensity |
|---|---|---|---|
| Tel Aviv District | 15,790,683 tn | 11.68 tn | 91,727.9 tons/km² |
| Israel | 81,985,471 tn | 9.92 tn | 3,713.4 tons/km² |
| 2013 CO2 emissions (tonnes/year) | 15,790,683 tn |
| 2013 CO2 emissions (tonnes/year) per capita | 11.68 tn |
| 2013 CO2 emissions intensity (tonnes/km²/year) | 91,727.9 tons/km² |
Natural Hazards Risk
Relative risk out of 10
| Hazard | Risk Level |
|---|---|
| Flood | Medium (4) |
| Earthquake | Medium (4) |
* Risk, particularly concerning flood or landslide, may not be for the entire area.
- Dilley, M., R.S. Chen, U. Deichmann, A.L. Lerner-Lam, M. Arnold, J. Agwe, P. Buys, O. Kjekstad, B. Lyon, and G. Yetman. 2005. Natural Disaster Hotspots: A Global Risk Analysis. Washington, D.C.: World Bank. https://doi.org/10.1596/0-8213-5930-4.
- Center for Hazards and Risk Research - CHRR - Columbia University, Center for International Earth Science Information Network - CIESIN - Columbia University. 2005. Global Flood Hazard Frequency and Distribution. Palisades, NY: NASA Socioeconomic Data and Applications Center (SEDAC). https://doi.org/10.7927/H4668B3D.
- Center for Hazards and Risk Research - CHRR - Columbia University, Center for International Earth Science Information Network - CIESIN - Columbia University. 2005. Global Earthquake Hazard Distribution - Peak Ground Acceleration. Palisades, NY: NASA Socioeconomic Data and Applications Center (SEDAC). https://doi.org/10.7927/H4BZ63ZS.
Recent Nearby Earthquakes
Magnitude 3.0 and greater
| Date▼ | Time↕ | Magnitude↕ | Distance↕ | Depth↕ | Location↕ | Link |
|---|---|---|---|---|---|---|
| 8/7/11 | 8:52 AM | 4.1 | 62.1 km | 31,000 m | Dead Sea region | usgs.gov |
| 12/2/07 | 7:38 AM | 4 | 85.9 km | 10,000 m | Dead Sea region | usgs.gov |
| 11/23/07 | 10:19 PM | 4.4 | 28.2 km | 11,000 m | Dead Sea region | usgs.gov |
| 11/20/07 | 11:21 PM | 3.2 | 89.1 km | 5,000 m | Dead Sea region | usgs.gov |
| 11/20/07 | 9:18 AM | 4.6 | 86.2 km | 10,000 m | Dead Sea region | usgs.gov |
| 11/18/06 | 2:57 AM | 3.1 | 65 km | 10,000 m | Dead Sea region | usgs.gov |
| 9/17/06 | 8:22 AM | 4 | 67 km | 1,000 m | Dead Sea region | usgs.gov |
| 9/9/06 | 4:58 AM | 4.5 | 68.9 km | 1,000 m | Dead Sea region | usgs.gov |
| 10/3/05 | 4:05 AM | 4.4 | 76.9 km | 10,000 m | Dead Sea region | usgs.gov |
| 8/8/04 | 12:42 PM | 4 | 64.9 km | 10,000 m | Dead Sea region | usgs.gov |
Menashiya
Menashiya or Manshiyya, was a residential neighborhood of Jaffa, Israel. It was located on the border between Jaffa and Tel Aviv. The neighborhood was demolished in order to build a central business district, but only some of the planned office build..
Menashiya Wikipedia Page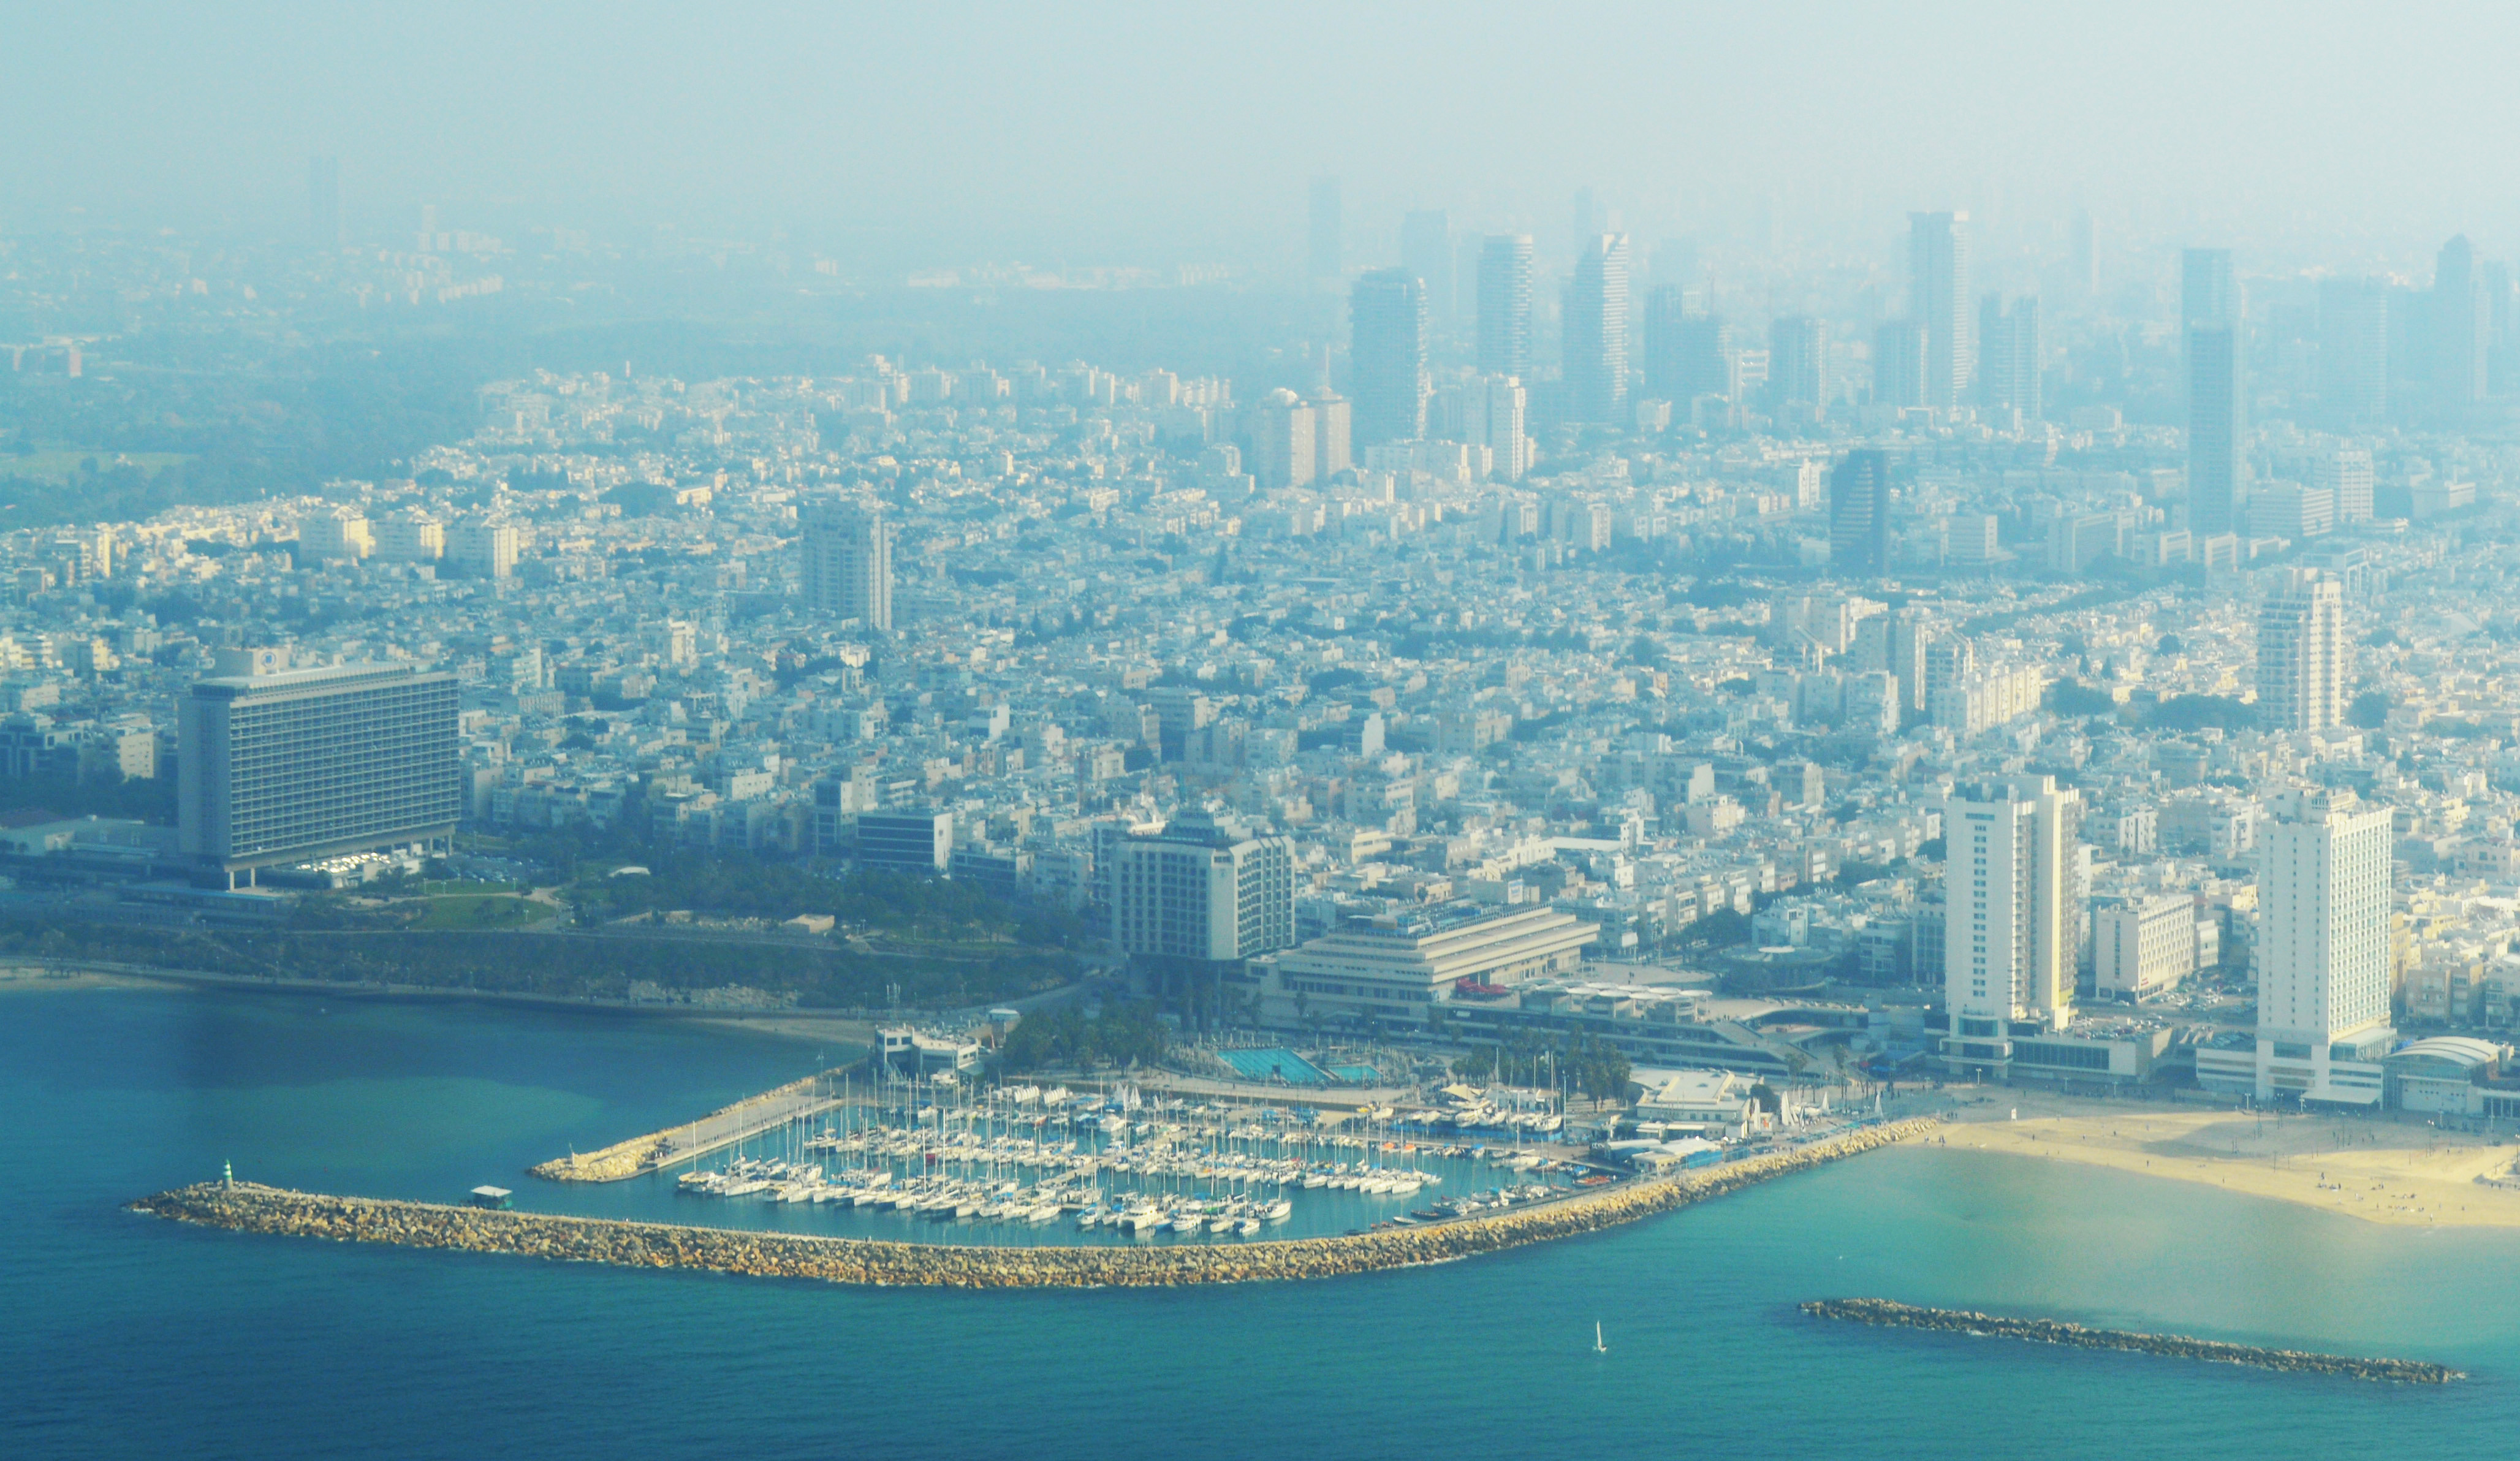


About Our Data
The data on this page is estimated using a number of publicly available tools and resources. It is provided without warranty, and could contain inaccuracies. Use at your own risk.