Categories in Sallama
Sallama Facts
| Area | 1.8 km² |
| Population | 2,904 |
| Male Population | 1,442 (49.7%) |
| Female Population | 1,462 (50.3%) |
| Population change (1975 to 2020) | +7966.7% |
| Population change (2000 to 2020) | +75.6% |
| Median Age | 27.1 years (Male: 26, Female: 28.1) |
| Local Time | |
| Timezone | Israel Daylight Time |
| Lat & Lng | 32.89443, 35.36931 |
| Postal Codes | 20101 |
Map of Sallama
Interactive Map
Sallama Population
Years 1975 to 2020
| Data | 1975 | 1990 | 2000 | 2015 | 2020 |
|---|---|---|---|---|---|
| Population | 36 | 729 | 1,654 | 2,662 | 2,904 |
| Population Density | 20.6 / km² | 416.6 / km² | 945.1 / km² | 1,521.1 / km² | 1,659.4 / km² |
Sallama Population change from 2000 to 2015
Increase of 60.9% from year 2000 to 2015
| Location | Change since 1975 | Change since 1990 | Change since 2000 |
|---|---|---|---|
| Sallama | +7294.4% | +265.2% | +60.9% |
| Northern District (Israel) | +142.6% | +78.8% | +33.6% |
| Israel | +141.5% | +78.8% | +33.8% |
Sallama Median Age
Median Age: 27.1 years
| Location | Median Age | Median Age (Female) | Median Age (Male) |
|---|---|---|---|
| Sallama | 27.1 yrs | 28.1 yrs | 26 yrs |
| Northern District (Israel) | 26.9 yrs | 27.7 yrs | 26.2 yrs |
| Israel | 29.5 yrs | 30.6 yrs | 28.5 yrs |
Sallama Population Density
Population Density: 1,659 / km²
| Location | Population | Area | Density |
|---|---|---|---|
| Sallama | 2,904 | 1.75 km² | 1,659 / km² |
| Northern District (Israel) | 1.4 million | 4,641.2 km² | 304 / km² |
| Israel | 8.3 million | 22,078 km² | 374 / km² |
Sallama Historical and Projected Population
Estimated Population from 1975 to 2100
- JRC (European Commission's Joint Research Centre) work on the GHS built-up grid
- CIESIN (Center for International Earth Science Information Network)
- [Link] Klein Goldewijk, K., Beusen, A., Doelman, J., and Stehfest, E.: Anthropogenic land use estimates for the Holocene – HYDE 3.2, Earth Syst. Sci. Data, 9, 927–953, https://doi.org/10.5194/essd-9-927-2017, 2017.
Human Development Index (HDI)
Statistic composite index of life expectancy, education, and per capita income.
Sallama CO2 Emissions
Carbon Dioxide (CO2) Emissions Per Capita in Tonnes Per Year
| Location | CO2 Emissions | CO2 Emissions Per Capita | CO2 Emissions Intensity |
|---|---|---|---|
| Sallama | 29,296 tn | 10.09 tn | 16,740.3 tons/km² |
| Northern District (Israel) | 11,734,870 tn | 8.32 tn | 2,528.4 tons/km² |
| Israel | 81,985,471 tn | 9.92 tn | 3,713.4 tons/km² |
| 2013 CO2 emissions (tonnes/year) | 29,296 tn |
| 2013 CO2 emissions (tonnes/year) per capita | 10.09 tn |
| 2013 CO2 emissions intensity (tonnes/km²/year) | 16,740.3 tons/km² |
Natural Hazards Risk
Relative risk out of 10
| Hazard | Risk Level |
|---|---|
| Drought | High (9) |
| Flood | Medium (7) |
| Earthquake | Medium (7) |
* Risk, particularly concerning flood or landslide, may not be for the entire area.
- Dilley, M., R.S. Chen, U. Deichmann, A.L. Lerner-Lam, M. Arnold, J. Agwe, P. Buys, O. Kjekstad, B. Lyon, and G. Yetman. 2005. Natural Disaster Hotspots: A Global Risk Analysis. Washington, D.C.: World Bank. https://doi.org/10.1596/0-8213-5930-4.
- Center for Hazards and Risk Research - CHRR - Columbia University, Center for International Earth Science Information Network - CIESIN - Columbia University, and International Research Institute for Climate and Society - IRI - Columbia University. 2005. Global Drought Hazard Frequency and Distribution. Palisades, NY: NASA Socioeconomic Data and Applications Center (SEDAC). https://doi.org/10.7927/H4VX0DFT.
- Center for Hazards and Risk Research - CHRR - Columbia University, Center for International Earth Science Information Network - CIESIN - Columbia University. 2005. Global Flood Hazard Frequency and Distribution. Palisades, NY: NASA Socioeconomic Data and Applications Center (SEDAC). https://doi.org/10.7927/H4668B3D.
- Center for Hazards and Risk Research - CHRR - Columbia University, Center for International Earth Science Information Network - CIESIN - Columbia University. 2005. Global Earthquake Hazard Distribution - Peak Ground Acceleration. Palisades, NY: NASA Socioeconomic Data and Applications Center (SEDAC). https://doi.org/10.7927/H4BZ63ZS.
Recent Nearby Earthquakes
Magnitude 3.0 and greater
| Date▼ | Time↕ | Magnitude↕ | Distance↕ | Depth↕ | Location↕ | Link |
|---|---|---|---|---|---|---|
| 11/3/18 | 5:42 PM | 3.8 | 96.5 km | 32,140 m | 44km WNW of Sidon, Lebanon | usgs.gov |
| 7/4/18 | 7:45 PM | 4.7 | 12.8 km | 10,000 m | 5km SE of 'Eilabun, Israel | usgs.gov |
| 7/4/18 | 1:50 AM | 4 | 13.6 km | 10,000 m | 6km SSE of 'Eilabun, Israel | usgs.gov |
| 7/5/14 | 9:41 PM | 4 | 76.8 km | 12,700 m | 3km NE of Sidon, Lebanon | usgs.gov |
| 10/20/13 | 12:54 PM | 3.5 | 19.3 km | 5,000 m | 8km NNE of Tiberias, Israel | usgs.gov |
| 8/7/11 | 8:52 AM | 4.1 | 91.8 km | 31,000 m | Dead Sea region | usgs.gov |
| 7/10/09 | 6:19 PM | 4 | 45.6 km | 10,000 m | Lebanon - Syria region | usgs.gov |
| 8/13/08 | 6:05 AM | 3.2 | 78.5 km | 10,000 m | eastern Mediterranean Sea | usgs.gov |
| 7/2/08 | 9:29 AM | 3.1 | 61.4 km | 20,100 m | Lebanon - Syria region | usgs.gov |
| 6/23/08 | 3:45 PM | 3 | 44.2 km | 1,000 m | Lebanon - Syria region | usgs.gov |
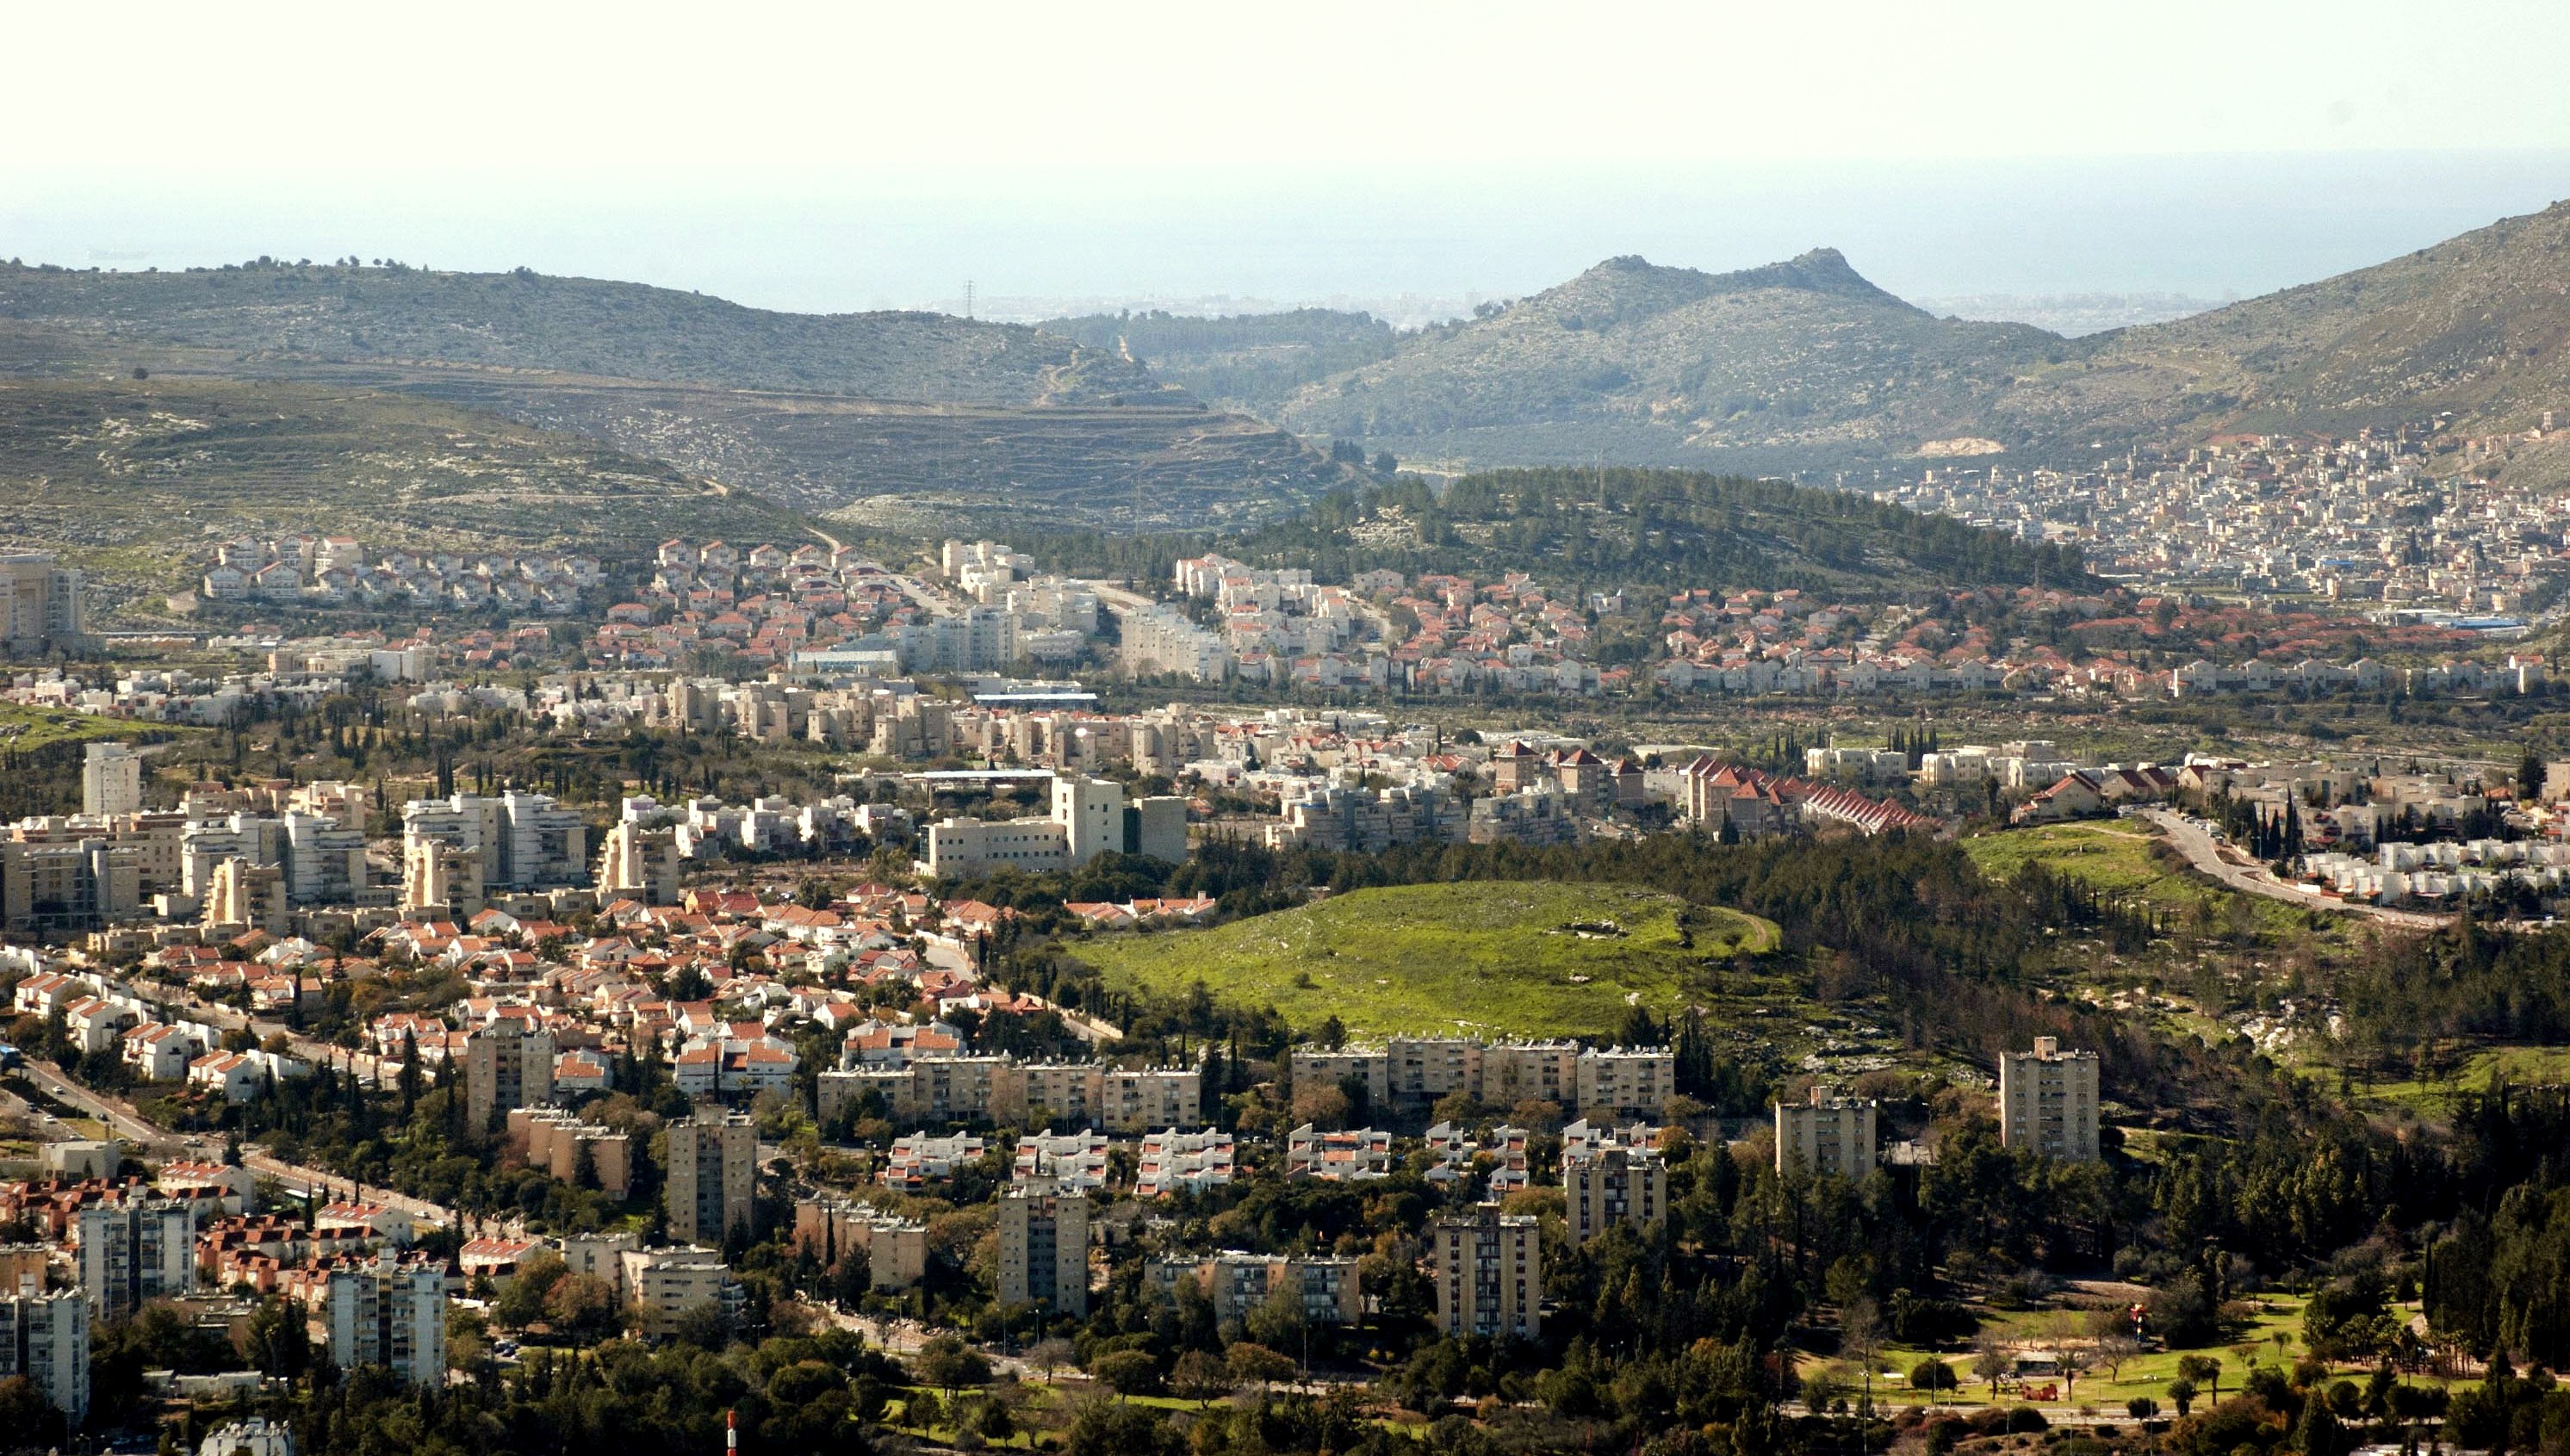
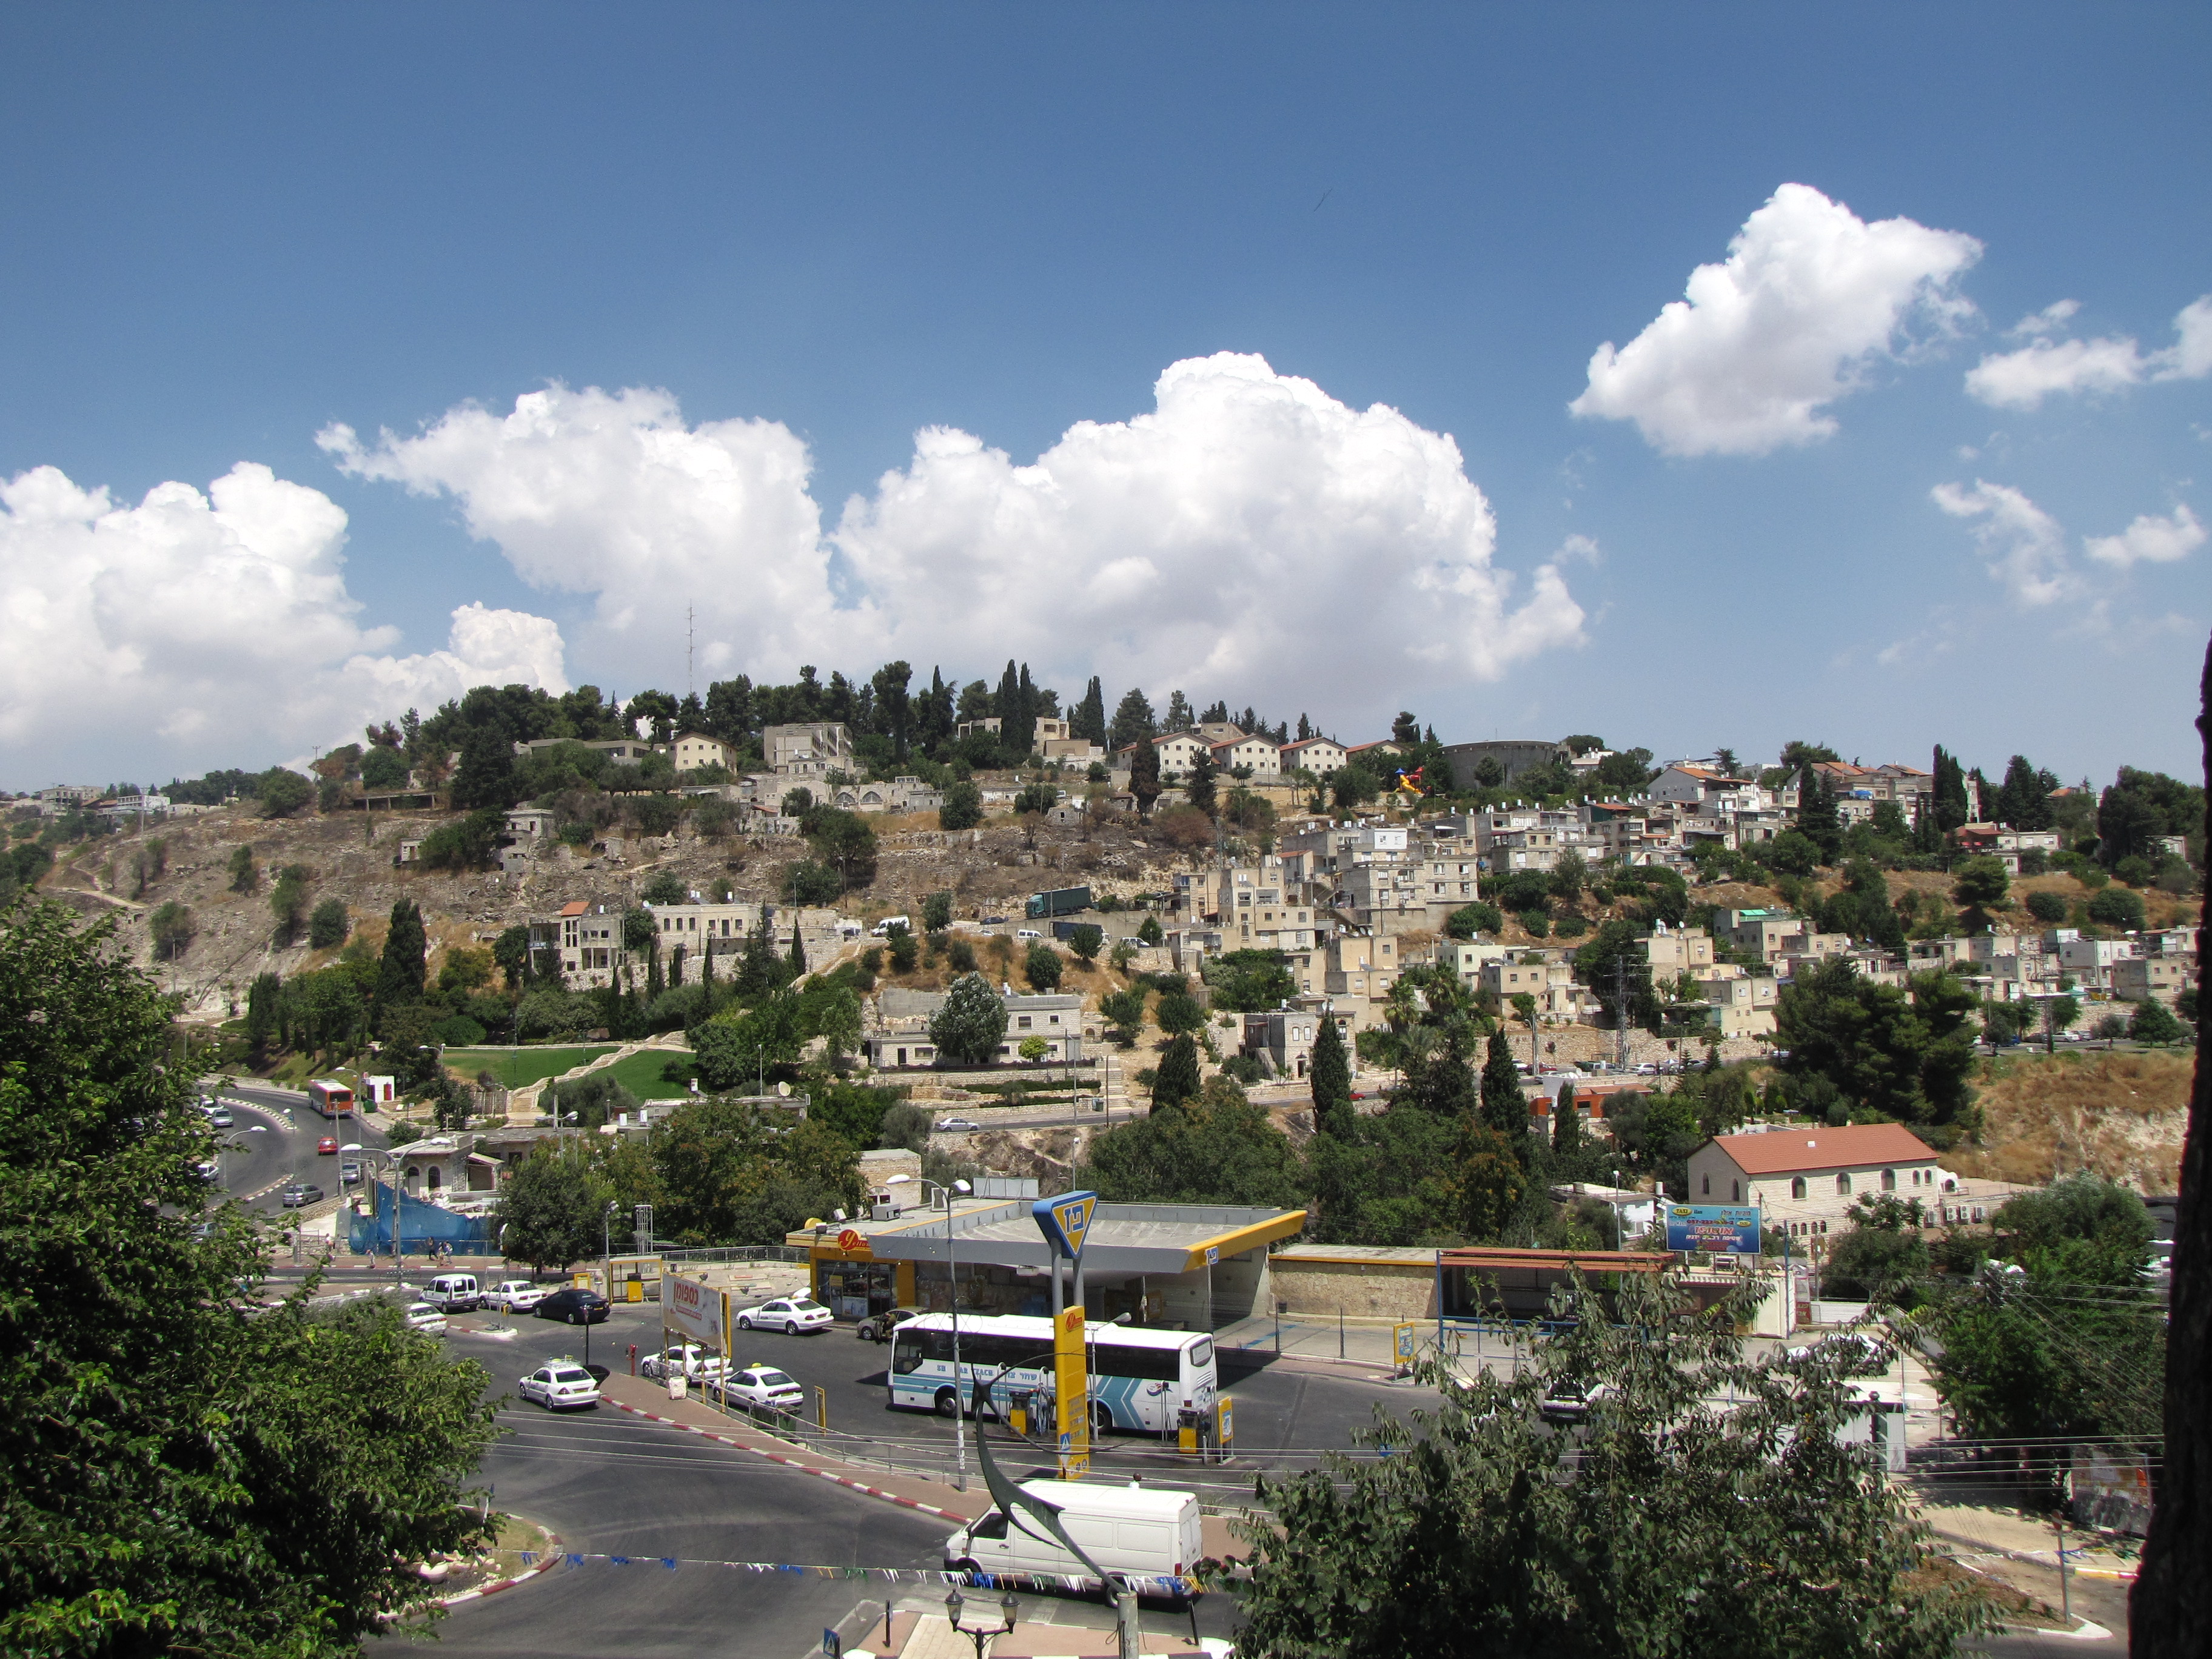
Sallama
Sallama (Arabic: سلامة; Hebrew: סלאמה) is a Bedouin village in northern Israel. Located in the Galilee near the Tzalmon Stream, it falls under the jurisdiction of Misgav Regional Council. In 2007 it had a population of 2,100. village was recognise..
Sallama Wikipedia Page

About Our Data
The data on this page is estimated using a number of publicly available tools and resources. It is provided without warranty, and could contain inaccuracies. Use at your own risk.