Categories in Deeg
Industries
Business Distribution by Industry in Deeg
| Industry Description | Number of Establishments |
|---|---|
| Shopping | 119 |
| Shopping other | 87 |
| Hindu temple | 67 |
| Education | 64 |
| Grocery stores and supermarkets | 58 |
| Electronics stores | 49 |
| Candy stores | 48 |
| Clothing stores | 46 |
| Pharmacies and drug stores | 32 |
Deeg Facts
| Area | 7.8 km² |
| Population | 132,660 |
| Male Population | 70,612 (53.2%) |
| Female Population | 62,048 (46.8%) |
| Population change (1975 to 2020) | +37.5% |
| Population change (2000 to 2020) | +6.0% |
| Median Age | 20.7 years (Male: 20.3, Female: 21.2) |
| Local Time | |
| Timezone | India Standard Time |
| Lat & Lng | 27.47188, 77.32564 |
Map of Deeg
Interactive Map
Deeg Population
Years 1975 to 2020
| Data | 1975 | 1990 | 2000 | 2015 | 2020 |
|---|---|---|---|---|---|
| Population | 96,487 | 118,086 | 125,145 | 124,569 | 132,660 |
| Population Density | 12,350.3 / km² | 15,115 / km² | 16,018.6 / km² | 15,944.8 / km² | 16,980.5 / km² |
Deeg Population change from 2000 to 2015
Decrease of 0.5% from year 2000 to 2015
| Location | Change since 1975 | Change since 1990 | Change since 2000 |
|---|---|---|---|
| Deeg | +29.1% | +5.5% | -0.5% |
| Rajasthan | +141.7% | +63.1% | +30.2% |
| India | +111.1% | +50.6% | +24.5% |
Deeg Median Age
Median Age: 20.7 years
| Location | Median Age | Median Age (Female) | Median Age (Male) |
|---|---|---|---|
| Deeg | 20.7 yrs | 21.2 yrs | 20.3 yrs |
| Rajasthan | 22.4 yrs | 23 yrs | 21.9 yrs |
| India | 24.9 yrs | 25.4 yrs | 24.5 yrs |
Deeg Population Density
Population Density: 16,981 / km²
| Location | Population | Area | Density |
|---|---|---|---|
| Deeg | 132,660 | 7.8 km² | 16,981 / km² |
| Rajasthan | 75.3 million | 342,463 km² | 220 / km² |
| India | 1,307 million | 3,083,563.4 km² | 424 / km² |
Deeg Historical and Projected Population
Estimated Population from 0 to 2100
- JRC (European Commission's Joint Research Centre) work on the GHS built-up grid
- CIESIN (Center for International Earth Science Information Network)
- [Link] Klein Goldewijk, K., Beusen, A., Doelman, J., and Stehfest, E.: Anthropogenic land use estimates for the Holocene – HYDE 3.2, Earth Syst. Sci. Data, 9, 927–953, https://doi.org/10.5194/essd-9-927-2017, 2017.
Human Development Index (HDI)
Statistic composite index of life expectancy, education, and per capita income.
Deeg CO2 Emissions
Carbon Dioxide (CO2) Emissions Per Capita in Tonnes Per Year
| Location | CO2 Emissions | CO2 Emissions Per Capita | CO2 Emissions Intensity |
|---|---|---|---|
| Deeg | 199,368 tn | 1.5 tn | 25,519.2 tons/km² |
| Rajasthan | 105,422,055 tn | 1.4 tn | 307.8 tons/km² |
| India | 1,928,568,344 tn | 1.48 tn | 625.4 tons/km² |
| 2013 CO2 emissions (tonnes/year) | 199,368 tn |
| 2013 CO2 emissions (tonnes/year) per capita | 1.5 tn |
| 2013 CO2 emissions intensity (tonnes/km²/year) | 25,519.2 tons/km² |
Natural Hazards Risk
Relative risk out of 10
| Hazard | Risk Level |
|---|---|
| Drought | High (10) |
| Flood | High (10) |
| Earthquake | Medium (4) |
* Risk, particularly concerning flood or landslide, may not be for the entire area.
- Dilley, M., R.S. Chen, U. Deichmann, A.L. Lerner-Lam, M. Arnold, J. Agwe, P. Buys, O. Kjekstad, B. Lyon, and G. Yetman. 2005. Natural Disaster Hotspots: A Global Risk Analysis. Washington, D.C.: World Bank. https://doi.org/10.1596/0-8213-5930-4.
- Center for Hazards and Risk Research - CHRR - Columbia University, Center for International Earth Science Information Network - CIESIN - Columbia University, and International Research Institute for Climate and Society - IRI - Columbia University. 2005. Global Drought Hazard Frequency and Distribution. Palisades, NY: NASA Socioeconomic Data and Applications Center (SEDAC). https://doi.org/10.7927/H4VX0DFT.
- Center for Hazards and Risk Research - CHRR - Columbia University, Center for International Earth Science Information Network - CIESIN - Columbia University. 2005. Global Flood Hazard Frequency and Distribution. Palisades, NY: NASA Socioeconomic Data and Applications Center (SEDAC). https://doi.org/10.7927/H4668B3D.
- Center for Hazards and Risk Research - CHRR - Columbia University, Center for International Earth Science Information Network - CIESIN - Columbia University. 2005. Global Earthquake Hazard Distribution - Peak Ground Acceleration. Palisades, NY: NASA Socioeconomic Data and Applications Center (SEDAC). https://doi.org/10.7927/H4BZ63ZS.
Recent Nearby Earthquakes
Magnitude 3.0 and greater
| Date▼ | Time↕ | Magnitude↕ | Distance↕ | Depth↕ | Location↕ | Link |
|---|---|---|---|---|---|---|
| 3/16/19 | 11:41 PM | 4 | 45.4 km | 10,000 m | 11km W of Govindgarh, India | usgs.gov |
| 11/16/16 | 10:59 PM | 4.4 | 85 km | 10,000 m | 14km SE of Bawal, India | usgs.gov |
| 10/18/07 | 5:54 AM | 4.7 | 45.7 km | 10,000 m | Rajasthan-Uttar Pradesh border region, India | usgs.gov |
| 11/29/06 | 5:41 AM | 4 | 50.9 km | 10,000 m | Rajasthan, India | usgs.gov |
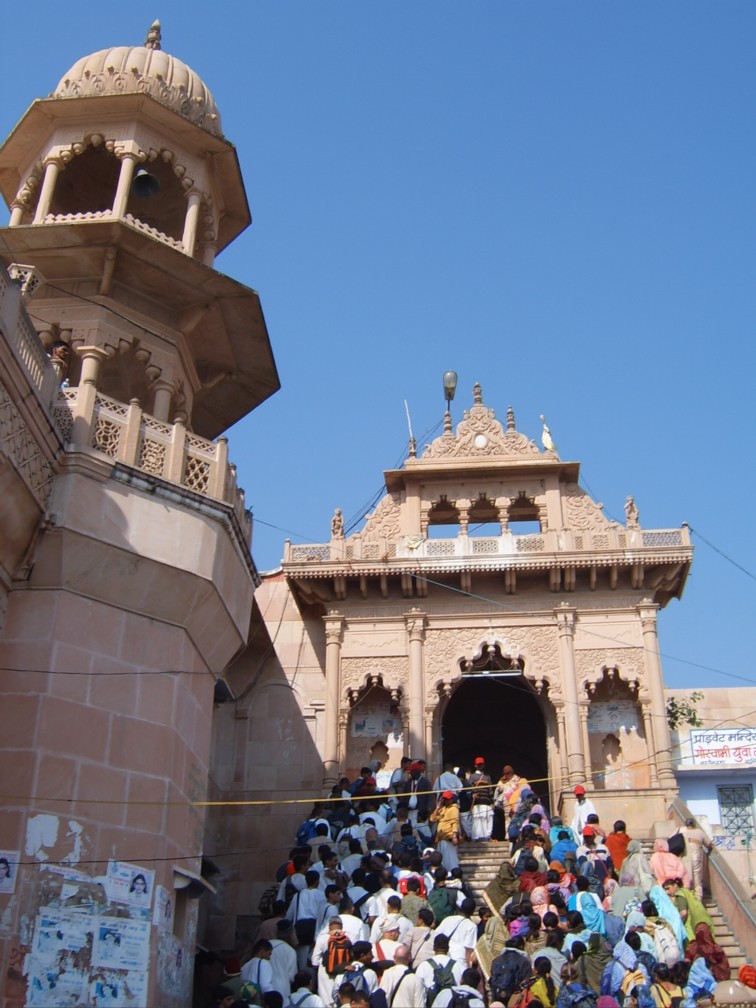
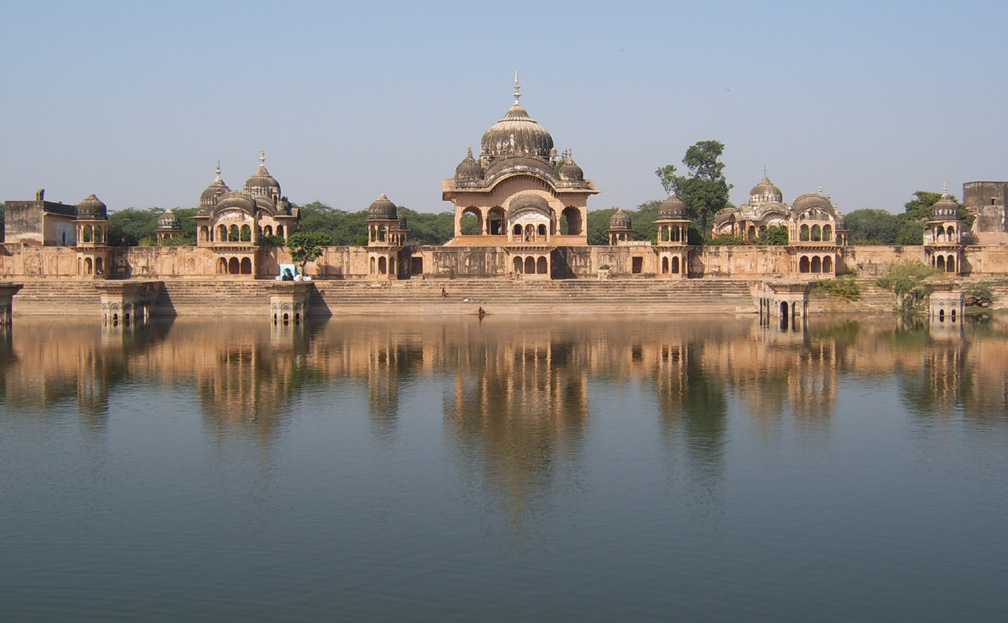
Deeg
Deeg is a town and a municipality in Bharatpur district in the state of Rajasthan, India. It is situated 32 kilometres (20 mi) north of Bharatpur and 98 kilometres (61 mi) north of Agra. Hindu mythology, Deeg was situated along the parikrama path of..
Deeg Wikipedia Page
About Our Data
The data on this page is estimated using a number of publicly available tools and resources. It is provided without warranty, and could contain inaccuracies. Use at your own risk.