Categories in Harrai
Auto Parts StoreCar repairGas StationMechanicMotorcycle repairFarmingWholesalersClothing storesJewelers and watchesMen's clothingShoe storesMobile phone storesCommunity CenterGovernment OfficeHindu templeMosquesPost OfficeReligionReligious DestinationReligious InstitutionSoup KitchenVillage HallCell phone accessory storeComputer ServiceElectronics Repair ShopElectronics StoreMobile Phone Repair ShopBuilding Materials StoreConstruction of buildingsConstruction of housesHardware storeHome Goods StoreHousing DevelopmentCollegeEducationEducational InstitutionEducation CenterElementary SchoolGeneral education schoolGovernment SchoolHigh SchoolHome HelpMiddle SchoolPreschoolPrimary SchoolSecondary schoolArt galleriesDJ ServicePhotographerPhotography ServicePhotography StudioTourist AttractionBakeriesButcherCafesCheese, dairy and eggsChicken RestaurantChicken ShopCoffee ShopDhabaFast food restaurantsGrocery stores and supermarketsIce Cream ShopInternet cafesRestaurantsFurniture storesNurseries and garden suppliesTailorAtm'sBanksBusiness banking serviceInsurance AgencyHome Health Care ServiceHospitalsMedical CenterMedical clinicBeauty salonsHair SalonBusiness CenterApartment BuildingApartment ComplexCondominium ComplexHousing ComplexBook stores and newsstandsComputer storesCosmetics StoreGeneral StoreMarketOnline Share Trading CenterPharmacyShoppingShopping MallSupermarketTea StoreTobacco ShopGymPlaygroundPublic parksHotels and motelsHousing SocietyLodgingTransportation ServiceTravel AgencyWarehouse
Harrai Facts
| Area | 1570.4 km² |
| Population | 150,499 |
| Male Population | 75,639 (50.3%) |
| Female Population | 74,860 (49.7%) |
| Population change (1975 to 2020) | +93.0% |
| Population change (2000 to 2020) | +26.2% |
| Median Age | 24.7 years (Male: 24.5, Female: 24.9) |
| Area Codes | 7168 |
| Neighborhoods | Shah Mohalla |
| Local Time | |
| Timezone | India Standard Time |
| Lat & Lng | 22.61428, 79.22207 |
| Pin Codes | 480224 |
Map of Harrai
Interactive Map
Harrai Population
Years 1975 to 2020
| Data | 1975 | 1990 | 2000 | 2015 | 2020 |
|---|---|---|---|---|---|
| Population | 77,977 | 99,791 | 119,220 | 140,919 | 150,499 |
| Population Density | 49.7 / km² | 63.5 / km² | 75.9 / km² | 89.7 / km² | 95.8 / km² |
Sources: JRC (European Commission's Joint Research Centre) work on the GHS built-up grid
Harrai Population change from 2000 to 2015
Increase of 18.2% from year 2000 to 2015
| Location | Change since 1975 | Change since 1990 | Change since 2000 |
|---|---|---|---|
| Harrai | +80.7% | +41.2% | +18.2% |
| Madhya Pradesh | +134% | +59.7% | +28.6% |
| India | +111.1% | +50.6% | +24.5% |
Sources: JRC (European Commission's Joint Research Centre) work on the GHS built-up grid
Harrai Median Age
Median Age: 24.7 years
| Location | Median Age | Median Age (Female) | Median Age (Male) |
|---|---|---|---|
| Harrai | 24.7 yrs | 24.9 yrs | 24.5 yrs |
| Madhya Pradesh | 23.4 yrs | 23.7 yrs | 23.1 yrs |
| India | 24.9 yrs | 25.4 yrs | 24.5 yrs |
Sources: CIESIN (Center for International Earth Science Information Network)
Harrai Population Density
Population Density: 95.8 / km²
| Location | Population | Area | Density |
|---|---|---|---|
| Harrai | 150,499 | 1,570.4 km² | 95.8 / km² |
| Madhya Pradesh | 79.1 million | 308,149.6 km² | 257 / km² |
| India | 1,307 million | 3,083,563.4 km² | 424 / km² |
Sources: JRC (European Commission's Joint Research Centre) work on the GHS built-up grid
Harrai Historical and Projected Population
Estimated Population from 0 to 2100
Sources:
- JRC (European Commission's Joint Research Centre) work on the GHS built-up grid
- CIESIN (Center for International Earth Science Information Network)
- [Link] Klein Goldewijk, K., Beusen, A., Doelman, J., and Stehfest, E.: Anthropogenic land use estimates for the Holocene – HYDE 3.2, Earth Syst. Sci. Data, 9, 927–953, https://doi.org/10.5194/essd-9-927-2017, 2017.
Human Development Index (HDI)
Statistic composite index of life expectancy, education, and per capita income.
Source: [Link] Kummu, M., Taka, M. &Guillaume, J. Gridded global datasets for Gross Domestic Product and Human Development Index over 1990–2015. Sci Data 5, 180004 (2018) doi:10.1038/sdata.2018.4
Harrai CO2 Emissions
Carbon Dioxide (CO2) Emissions Per Capita in Tonnes Per Year
| Location | CO2 Emissions | CO2 Emissions Per Capita | CO2 Emissions Intensity |
|---|---|---|---|
| Harrai | 185,736 tn | 1.23 tn | 118.3 tons/km² |
| Madhya Pradesh | 98,758,435 tn | 1.25 tn | 320.5 tons/km² |
| India | 1,928,568,344 tn | 1.48 tn | 625.4 tons/km² |
Sources: [Link] Moran, D., Kanemoto K; Jiborn, M., Wood, R., Többen, J., and Seto, K.C. (2018) Carbon footprints of 13,000 cities. Environmental Research Letters DOI: 10.1088/1748-9326/aac72a
Harrai CO2 Emissions
| 2013 CO2 emissions (tonnes/year) | 185,736 tn |
| 2013 CO2 emissions (tonnes/year) per capita | 1.23 tn |
| 2013 CO2 emissions intensity (tonnes/km²/year) | 118.3 tons/km² |
Natural Hazards Risk
Relative risk out of 10
| Hazard | Risk Level |
|---|---|
| Drought | High (8) |
| Earthquake | Low (2) |
* Risk, particularly concerning flood or landslide, may not be for the entire area.
Sources:
- Dilley, M., R.S. Chen, U. Deichmann, A.L. Lerner-Lam, M. Arnold, J. Agwe, P. Buys, O. Kjekstad, B. Lyon, and G. Yetman. 2005. Natural Disaster Hotspots: A Global Risk Analysis. Washington, D.C.: World Bank. https://doi.org/10.1596/0-8213-5930-4.
- Center for Hazards and Risk Research - CHRR - Columbia University, Center for International Earth Science Information Network - CIESIN - Columbia University, and International Research Institute for Climate and Society - IRI - Columbia University. 2005. Global Drought Hazard Frequency and Distribution. Palisades, NY: NASA Socioeconomic Data and Applications Center (SEDAC). https://doi.org/10.7927/H4VX0DFT.
- Center for Hazards and Risk Research - CHRR - Columbia University, Center for International Earth Science Information Network - CIESIN - Columbia University. 2005. Global Earthquake Hazard Distribution - Peak Ground Acceleration. Palisades, NY: NASA Socioeconomic Data and Applications Center (SEDAC). https://doi.org/10.7927/H4BZ63ZS.
Recent Nearby Earthquakes
Magnitude 3.0 and greater
| Date▼ | Time↕ | Magnitude↕ | Distance↕ | Depth↕ | Location↕ | Link |
|---|---|---|---|---|---|---|
| 6/4/97 | 7:29 PM | 3.9 | 96.6 km | 33,000 m | Madhya Pradesh, India | usgs.gov |
| 5/21/97 | 10:51 PM | 5.8 | 98.8 km | 36,000 m | Madhya Pradesh, India | usgs.gov |
| 4/18/87 | 4:59 PM | 4.9 | 30 km | 33,000 m | Madhya Pradesh, India | usgs.gov |
Source: U.S. Geological Survey (USGS)
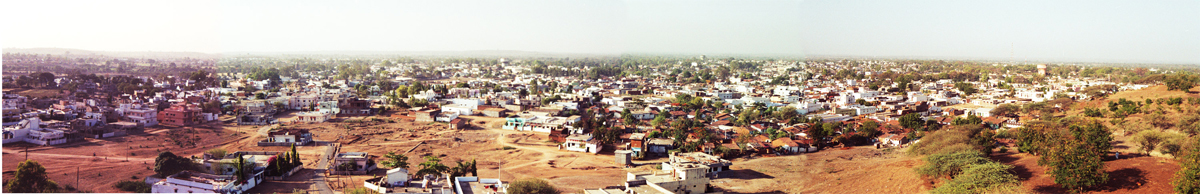
Harrai
Harrai is a sub-district and a nagar panchayat in Chhindwara district in the Indian state of Madhya Pradesh.
Harrai Wikipedia Page

About Our Data
The data on this page is estimated using a number of publicly available tools and resources. It is provided without warranty, and could contain inaccuracies. Use at your own risk.