- World
- »
- IN
- »
- Rajasthan
- »
- Kapasan, Rajasthan
Businesses in Kapasan
Hotels & Travel
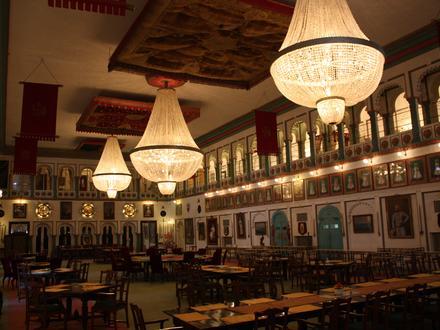
Restaurants
Automotive
Financial Services
Medical
Beauty & Spas
Community & Government
Industries
Business Distribution by Industry Shopping: 28.1%
Food: 15.8%
Religion: 11.7%
Restaurants: 7.4%
Education: 6.7%
Hotels & Travel: 5.6%
Other: 24.7%
| Area of Kapasan, Rajasthan | 889.2 km² |
| Population | 269,886 |
| Male Population | 135,918 (50.4%) |
| Female Population | 133,968 (49.6%) |
| Population change from 1975 to 2015 | +104.6% |
| Population change from 2000 to 2015 | +24% |
| Median Age | 24.8 |
| Male Median Age | 24.3 |
| Female Median Age | 25.3 |
| Area Codes | 1476 |
| Neighborhoods | Kumhar Mohalla, Rajeev Nagar |
| Local Time | Tuesday 5:59 PM |
| Timezone | India Standard Time |
| Lat & Lng | 24.8894° / 74.31667° |
| Pin Codes | 312202 |
Kapasan, Rajasthan - Map
Kapasan, Rajasthan Population
Years 1975 to 2015| Data | 1975 | 1990 | 2000 | 2015 |
|---|---|---|---|---|
| Population | 131,877 | 184,153 | 217,596 | 269,886 |
| Population Density | 148.3 / km² | 207.1 / km² | 244.7 / km² | 303.5 / km² |
Kapasan Population change from 2000 to 2015
Increase of 24% from year 2000 to 2015| Location | Change since 1975 | Change since 1990 | Change since 2000 |
|---|---|---|---|
| Kapasan, Rajasthan | +104.6% | +46.6% | +24% |
| Rajasthan | +141.7% | +63.1% | +30.2% |
| India | +111.1% | +50.6% | +24.5% |
Kapasan, Rajasthan Median Age
Median Age: 24.8 years| Location | Median Age | Median Age (Female) | Median Age (Male) |
|---|---|---|---|
| Kapasan, Rajasthan | 24.8 years | 25.3 years | 24.3 years |
| Rajasthan | 22.4 years | 23 years | 21.9 years |
| India | 24.9 years | 25.4 years | 24.5 years |
Kapasan, Rajasthan Population Tree
Population By Age and Gender| Age | Male | Female | Total |
|---|---|---|---|
| Under 5 | 13,840 | 12,932 | 26,773 |
| 5-9 | 15,325 | 14,168 | 29,494 |
| 10-14 | 15,101 | 13,939 | 29,040 |
| 15-19 | 13,207 | 13,088 | 26,295 |
| 20-24 | 12,250 | 12,150 | 24,401 |
| 25-29 | 10,520 | 10,523 | 21,043 |
| 30-34 | 9,760 | 9,990 | 19,750 |
| 35-39 | 9,356 | 9,365 | 18,721 |
| 40-44 | 8,275 | 7,979 | 16,255 |
| 45-49 | 6,903 | 6,864 | 13,768 |
| 50-54 | 5,902 | 5,323 | 11,226 |
| 55-59 | 4,131 | 4,597 | 8,729 |
| 60-64 | 4,043 | 4,258 | 8,301 |
| 65-69 | 2,763 | 3,330 | 6,094 |
| 70-74 | 2,388 | 2,604 | 4,993 |
| 75-79 | 999 | 1,289 | 2,289 |
| 80-84 | 684 | 915 | 1,600 |
| 85 Plus | 469 | 654 | 1,124 |
Kapasan, Rajasthan Population Density
Population Density: 303.5 / km²| Location | Population | Area | Population Density |
|---|---|---|---|
| Kapasan, Rajasthan | 269,886 | 889.2 km² | 303.5 / km² |
| Rajasthan | 75.3 million | 342,463 km² | 219.8 / km² |
| India | 1.3 billion | 3,083,563.4 km² | 423.8 / km² |
Kapasan, Rajasthan Historical and Projected Population
Estimated Ancient Population until 2100Sources:
1. JRC (European Commission's Joint Research Centre) work on the GHS built-up grid
2. CIESIN (Center for International Earth Science Information Network)
3. [Link] Klein Goldewijk, K., Beusen, A., Doelman, J., and Stehfest, E.: Anthropogenic land use estimates for the Holocene – HYDE 3.2, Earth Syst. Sci. Data, 9, 927–953, https://doi.org/10.5194/essd-9-927-2017, 2017.
Neighborhoods
Business Distribution by neighborhood in Kapasan Kumhar Mohalla: 65.2%
Rajeev Nagar: 13%
Bas stand: 4.3%
sukhadiya market: 4.3%
near railway station: 4.3%
Sector - A, Adarsh Nagar: 4.3%
Behind Court, RIICO Industrial Area: 4.3%
Area Codes
Percentage Area Codes used by businesses in Kapasan Area Code 1476: 75%
Area Code 180: 8.3%
Area Code 734: 8.3%
Area Code 861: 8.3%
Human Development Index (HDI)
Statistic composite index of life expectancy, education, and per capita income.Sources: [Link] Kummu, M., Taka, M. & Guillaume, J. Gridded global datasets for Gross Domestic Product and Human Development Index over 1990–2015. Sci Data 5, 180004 (2018) doi:10.1038/sdata.2018.4
Kapasan, Rajasthan CO2 Emissions
Carbon Dioxide (CO2) Emissions Per Capita in Tonnes Per Year| Location | CO2 Emissions | CO2 Emissions Per Capita | CO2 Emissions Intensity |
|---|---|---|---|
| Kapasan, Rajasthan | 371,623 tn | 1.38 tn | 417.9 tons/km² |
| Rajasthan | 105,422,054 tn | 1.4 tn | 307.8 tons/km² |
| India | 1,928,568,344 tn | 1.48 tn | 625.4 tons/km² |
Kapasan, Rajasthan CO2 Emissions
| 2013 CO2 emissions (tonnes/year) | 371,623 tn |
| 2013 CO2 emissions (tonnes/year) per capita | 1.38 tn |
| 2013 CO2 emissions intensity (tonnes/km²/year) | 417.9 tons/km² |
Natural Hazards Risk
Relative risk out of 10| Drought | High (9) |
* Risk, particularly concerning flood or landslide, may not be for the entire area.
Sources: 1. Dilley, M., R.S. Chen, U. Deichmann, A.L. Lerner-Lam, M. Arnold, J. Agwe, P. Buys, O. Kjekstad, B. Lyon, and G. Yetman. 2005. Natural Disaster Hotspots: A Global Risk Analysis. Washington, D.C.: World Bank. https://doi.org/10.1596/0-8213-5930-4.
2. Center for Hazards and Risk Research - CHRR - Columbia University, Center for International Earth Science Information Network - CIESIN - Columbia University, and International Research Institute for Climate and Society - IRI - Columbia University. 2005. Global Drought Hazard Frequency and Distribution. Palisades, NY: NASA Socioeconomic Data and Applications Center (SEDAC). https://doi.org/10.7927/H4VX0DFT.
Recent Nearby Earthquakes
Magnitude 3.0 and greater| Date | Time | Magnitude | Distance | Depth | Location | Link |
|---|---|---|---|---|---|---|
| 11/9/10 | 2:46 PM | 4.6 | 77.2 km | 13,500 m | Rajasthan, India | usgs.gov |
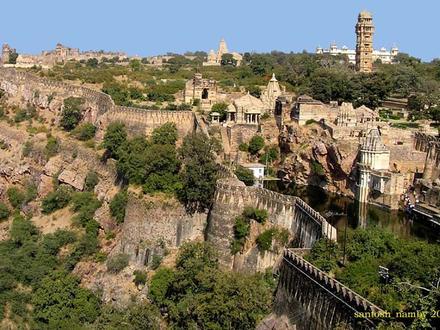
Kapasan, Rajasthan
Kapasan is a city and a municipality in Chittaurgarh district in the Indian state of Rajasthan. Kapasan Wikipedia Page

About Our Data
The data on this page is estimated using a number of publicly available tools and resources. It is provided without warranty, and could contain inaccuracies. Use at your own risk. See here for more information.