Categories in Tehran
Industries
Business Distribution by Industry in Tehran
| Industry Description | Number of Establishments | Average Google Rating |
|---|---|---|
| Shopping | 7,661 | 4.1 |
| Restaurants | 4,688 | 4 |
| Education | 2,451 | 4.1 |
| Banks | 2,107 | 3.8 |
| Corporate management | 2,070 | 4.3 |
| Office supplies and stationery stores | 1,998 | 4.1 |
| Cafes | 1,926 | 4.1 |
| Health and medical | 1,822 | 4.1 |
| Loan companies | 1,690 | 3.7 |
| Department stores | 1,210 | 4 |
| Fast food restaurants | 1,209 | 4 |
| Higher education (colleges and universities) | 1,141 | 4.1 |
| All food and beverage | 1,097 | 4.1 |
| Electronics stores | 1,070 | 4.2 |
| Hospitals | 999 | 3.8 |
| Construction of buildings | 960 | 4.1 |
| Real estate | 853 | 4 |
| Fitness centers | 803 | 4 |
| Public administration | 800 | 3.9 |
| Grocery stores and supermarkets | 775 | 4.1 |
| Bakeries | 735 | 4.1 |
| Civil engineering | 692 | 4.3 |
| Clothing stores | 690 | 4 |
| Religion | 688 | 4.1 |
| Pharmacies and drug stores | 668 | 4 |
Tehran Facts
| Area | 1654.1 km² |
| Population | 9,248,678 |
| Male Population | 4,659,521 (50.4%) |
| Female Population | 4,589,157 (49.6%) |
| Population change (1975 to 2020) | +3907.1% |
| Population change (2000 to 2020) | +40.6% |
| Median Age | 27.9 years (Male: 27.8, Female: 28) |
| Area Codes | 21 |
| Neighborhoods | District 6, District 3, District 2, District 1, District 7 |
| Local Time | |
| Timezone | Iran Standard Time |
| Lat & Lng | 35.69439, 51.42151 |
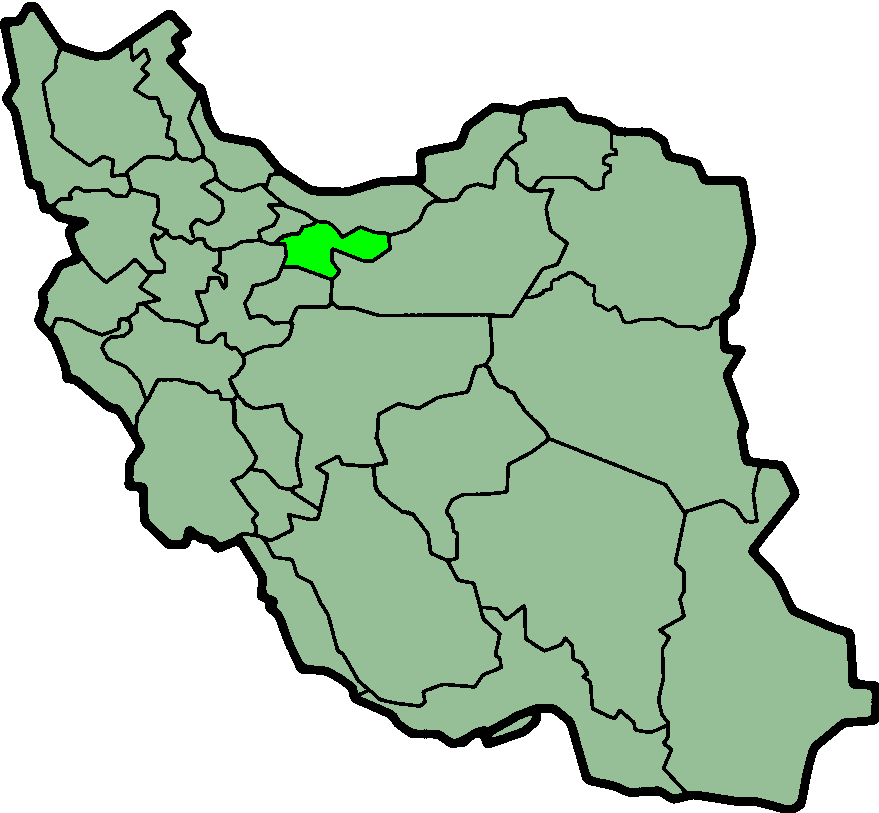
Map of Tehran
Interactive Map
Tehran Population
Years 1975 to 2020
| Data | 1975 | 1990 | 2000 | 2015 | 2020 |
|---|---|---|---|---|---|
| Population | 230,806 | 3,735,528 | 6,576,101 | 8,776,770 | 9,248,678 |
| Population Density | 139.5 / km² | 2,258.3 / km² | 3,975.6 / km² | 5,306 / km² | 5,591.3 / km² |
Tehran Population change from 2000 to 2015
Increase of 33.5% from year 2000 to 2015
| Location | Change since 1975 | Change since 1990 | Change since 2000 |
|---|---|---|---|
| Tehran | +3702.7% | +135% | +33.5% |
| Tehran Province | -55.6% | -38.7% | -0.5% |
| Iran | +141.5% | +40.9% | +20.2% |
Tehran Median Age
Median Age: 27.9 years
| Location | Median Age | Median Age (Female) | Median Age (Male) |
|---|---|---|---|
| Tehran | 27.9 yrs | 28 yrs | 27.8 yrs |
| Tehran Province | 27.9 yrs | 28 yrs | 27.8 yrs |
| Iran | 27.9 yrs | 28 yrs | 27.8 yrs |
Tehran Population Density
Population Density: 5,591 / km²
| Location | Population | Area | Density |
|---|---|---|---|
| Tehran | 9.2 million | 1,654.1 km² | 5,591 / km² |
| Tehran Province | 12.6 million | 13,711.4 km² | 922 / km² |
| Iran | 79.1 million | 1,623,090.1 km² | 48.7 / km² |
Tehran Historical and Projected Population
Estimated Population from 1970 to 2100
- JRC (European Commission's Joint Research Centre) work on the GHS built-up grid
- CIESIN (Center for International Earth Science Information Network)
- [Link] Klein Goldewijk, K., Beusen, A., Doelman, J., and Stehfest, E.: Anthropogenic land use estimates for the Holocene – HYDE 3.2, Earth Syst. Sci. Data, 9, 927–953, https://doi.org/10.5194/essd-9-927-2017, 2017.
Neighborhoods in Tehran
Percentage of businesses by neighborhood in Tehran
Area Codes
Percentage Area Codes used by businesses in Tehran
Price Distribution
Business distribution by price for Tehran
Human Development Index (HDI)
Statistic composite index of life expectancy, education, and per capita income.
Tehran CO2 Emissions
Carbon Dioxide (CO2) Emissions Per Capita in Tonnes Per Year
| Location | CO2 Emissions | CO2 Emissions Per Capita | CO2 Emissions Intensity |
|---|---|---|---|
| Tehran | 91,161,740 tn | 9.86 tn | 55,111.8 tons/km² |
| Tehran Province | 125,855,629 tn | 9.96 tn | 9,178.9 tons/km² |
| Iran | 601,639,824 tn | 7.6 tn | 370.7 tons/km² |
| 2013 CO2 emissions (tonnes/year) | 91,161,740 tn |
| 2013 CO2 emissions (tonnes/year) per capita | 9.86 tn |
| 2013 CO2 emissions intensity (tonnes/km²/year) | 55,111.8 tons/km² |
Natural Hazards Risk
Relative risk out of 10
| Hazard | Risk Level |
|---|---|
| Drought | Medium (5) |
| Flood | Medium (7) |
| Earthquake | High (8.7) |
| Landslide | Medium (6) |
* Risk, particularly concerning flood or landslide, may not be for the entire area.
- Dilley, M., R.S. Chen, U. Deichmann, A.L. Lerner-Lam, M. Arnold, J. Agwe, P. Buys, O. Kjekstad, B. Lyon, and G. Yetman. 2005. Natural Disaster Hotspots: A Global Risk Analysis. Washington, D.C.: World Bank. https://doi.org/10.1596/0-8213-5930-4.
- Center for Hazards and Risk Research - CHRR - Columbia University, Center for International Earth Science Information Network - CIESIN - Columbia University, and Norwegian Geotechnical Institute - NGI. 2005. Global Landslide Hazard Distribution. Palisades, NY: NASA Socioeconomic Data and Applications Center (SEDAC). https://doi.org/10.7927/H4P848VZ.
- Center for Hazards and Risk Research - CHRR - Columbia University, Center for International Earth Science Information Network - CIESIN - Columbia University, and International Research Institute for Climate and Society - IRI - Columbia University. 2005. Global Drought Hazard Frequency and Distribution. Palisades, NY: NASA Socioeconomic Data and Applications Center (SEDAC). https://doi.org/10.7927/H4VX0DFT.
- Center for Hazards and Risk Research - CHRR - Columbia University, Center for International Earth Science Information Network - CIESIN - Columbia University. 2005. Global Flood Hazard Frequency and Distribution. Palisades, NY: NASA Socioeconomic Data and Applications Center (SEDAC). https://doi.org/10.7927/H4668B3D.
- Center for Hazards and Risk Research - CHRR - Columbia University, Center for International Earth Science Information Network - CIESIN - Columbia University. 2005. Global Earthquake Hazard Distribution - Peak Ground Acceleration. Palisades, NY: NASA Socioeconomic Data and Applications Center (SEDAC). https://doi.org/10.7927/H4BZ63ZS.
Recent Nearby Earthquakes
Magnitude 3.0 and greater
| Date▼ | Time↕ | Magnitude↕ | Distance↕ | Depth↕ | Location↕ | Link |
|---|---|---|---|---|---|---|
| 4/1/18 | 6:26 PM | 4 | 89.8 km | 10,000 m | 23km NNE of Istgah-e Garmsar, Iran | usgs.gov |
| 12/26/17 | 9:24 PM | 4 | 15.2 km | 10,000 m | 15km W of Tehran, Iran | usgs.gov |
| 12/20/17 | 7:57 PM | 4.9 | 41.9 km | 10,000 m | 2km SW of Malard, Iran | usgs.gov |
| 8/16/14 | 11:55 PM | 4.1 | 84.3 km | 8,000 m | 33km NE of Damavand, Iran | usgs.gov |
| 5/10/14 | 10:04 PM | 4.1 | 87.4 km | 10,000 m | 39km SSW of Amol, Iran | usgs.gov |
| 8/17/12 | 8:31 PM | 3.8 | 44 km | 7,300 m | northern Iran | usgs.gov |
| 2/10/12 | 8:59 AM | 4.7 | 91.2 km | 14,300 m | northern Iran | usgs.gov |
| 2/20/11 | 11:22 AM | 4.2 | 47.2 km | 7,000 m | northern Iran | usgs.gov |
| 6/4/07 | 8:04 AM | 3.9 | 81.1 km | 3,900 m | northern Iran | usgs.gov |
| 12/20/06 | 4:39 AM | 4.2 | 41.8 km | 14,100 m | northern Iran | usgs.gov |
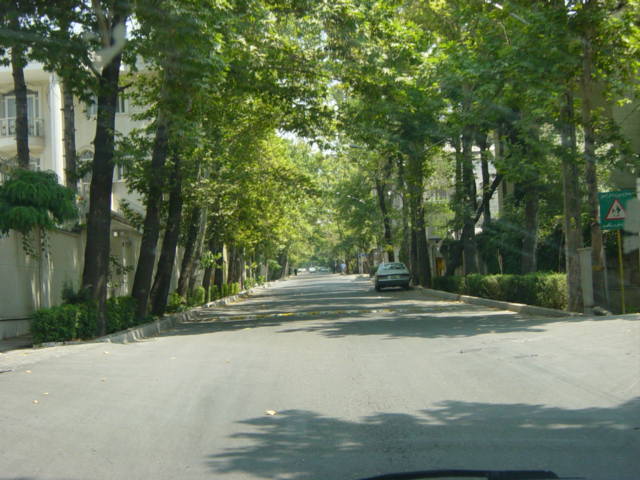
Tehran
Tehran ( pronunciation ; Persian: Tehrān – تهران) is the capital of Iran and Tehran Province. With a population of around 9 million in the city and 16 million in the wider metropolitan area, Tehran is the largest city and urban area of Iran, the se..
Tehran Wikipedia Page

About Our Data
The data on this page is estimated using a number of publicly available tools and resources. It is provided without warranty, and could contain inaccuracies. Use at your own risk.