Categories in Garður
Garður Facts
| Area | 1.6 km² |
| Population | 1,505 |
| Male Population | 793 (52.7%) |
| Female Population | 712 (47.3%) |
| Population change (1975 to 2020) | +143.9% |
| Population change (2000 to 2020) | +47.1% |
| Median Age | 32.9 years (Male: 32, Female: 33.9) |
| Neighborhoods | Öskjuhlíð |
| Local Time | |
| Timezone | Greenwich Mean Time |
| Lat & Lng | 64.06558, -22.64656 |
| Postal Codes | 250 |
Map of Garður
Interactive Map
Garður Population
Years 1975 to 2020
| Data | 1975 | 1990 | 2000 | 2015 | 2020 |
|---|---|---|---|---|---|
| Population | 617 | 881 | 1,023 | 1,386 | 1,505 |
| Population Density | 379.7 / km² | 542.2 / km² | 629.5 / km² | 852.9 / km² | 926.2 / km² |
Garður Population change from 2000 to 2015
Increase of 35.5% from year 2000 to 2015
| Location | Change since 1975 | Change since 1990 | Change since 2000 |
|---|---|---|---|
| Garður | +124.6% | +57.3% | +35.5% |
| Southern Peninsula (Iceland) | +192.4% | +89.6% | +45.3% |
| Iceland | +57.5% | +32.5% | +19% |
Garður Median Age
Median Age: 32.9 years
| Location | Median Age | Median Age (Female) | Median Age (Male) |
|---|---|---|---|
| Garður | 32.9 yrs | 33.9 yrs | 32 yrs |
| Southern Peninsula (Iceland) | 32.9 yrs | 33.1 yrs | 32.6 yrs |
| Iceland | 34.9 yrs | 35.5 yrs | 34.4 yrs |
Garður Population Density
Population Density: 926 / km²
| Location | Population | Area | Density |
|---|---|---|---|
| Garður | 1,505 | 1.625 km² | 926 / km² |
| Southern Peninsula (Iceland) | 19,511 | 881.6 km² | 22.1 / km² |
| Iceland | 305,309 | 102,490.8 km² | 3 / km² |
Garður Historical and Projected Population
Estimated Population from 1975 to 2100
- JRC (European Commission's Joint Research Centre) work on the GHS built-up grid
- CIESIN (Center for International Earth Science Information Network)
- [Link] Klein Goldewijk, K., Beusen, A., Doelman, J., and Stehfest, E.: Anthropogenic land use estimates for the Holocene – HYDE 3.2, Earth Syst. Sci. Data, 9, 927–953, https://doi.org/10.5194/essd-9-927-2017, 2017.
Area Codes
Percentage Area Codes used by businesses in Garður
Postal Codes
Percentage of businesses by Postal Codes in Garður
Human Development Index (HDI)
Statistic composite index of life expectancy, education, and per capita income.
Garður CO2 Emissions
Carbon Dioxide (CO2) Emissions Per Capita in Tonnes Per Year
| Location | CO2 Emissions | CO2 Emissions Per Capita | CO2 Emissions Intensity |
|---|---|---|---|
| Garður | 14,972 tn | 9.95 tn | 9,213.7 tons/km² |
| Southern Peninsula (Iceland) | 252,235 tn | 12.93 tn | 286.1 tons/km² |
| Iceland | 3,989,543 tn | 13.07 tn | 38.9 tons/km² |
| 2013 CO2 emissions (tonnes/year) | 14,972 tn |
| 2013 CO2 emissions (tonnes/year) per capita | 9.95 tn |
| 2013 CO2 emissions intensity (tonnes/km²/year) | 9,213.7 tons/km² |
Natural Hazards Risk
Relative risk out of 10
| Hazard | Risk Level |
|---|---|
| Earthquake | Medium (4) |
* Risk, particularly concerning flood or landslide, may not be for the entire area.
- Dilley, M., R.S. Chen, U. Deichmann, A.L. Lerner-Lam, M. Arnold, J. Agwe, P. Buys, O. Kjekstad, B. Lyon, and G. Yetman. 2005. Natural Disaster Hotspots: A Global Risk Analysis. Washington, D.C.: World Bank. https://doi.org/10.1596/0-8213-5930-4.
- Center for Hazards and Risk Research - CHRR - Columbia University, Center for International Earth Science Information Network - CIESIN - Columbia University. 2005. Global Earthquake Hazard Distribution - Peak Ground Acceleration. Palisades, NY: NASA Socioeconomic Data and Applications Center (SEDAC). https://doi.org/10.7927/H4BZ63ZS.
Recent Nearby Earthquakes
Magnitude 3.0 and greater
| Date▼ | Time↕ | Magnitude↕ | Distance↕ | Depth↕ | Location↕ | Link |
|---|---|---|---|---|---|---|
| 12/30/18 | 2:56 AM | 4.3 | 80.6 km | 10,000 m | 19km NNE of Hveragerdi, Iceland | usgs.gov |
| 7/1/15 | 5:00 AM | 4.5 | 48.2 km | 10,000 m | 42km WSW of Grindavik, Iceland | usgs.gov |
| 7/1/15 | 4:59 AM | 4.5 | 33.1 km | 10,000 m | 28km SW of Sandgerdi, Iceland | usgs.gov |
| 7/1/15 | 2:25 AM | 4.5 | 31.2 km | 10,000 m | 26km SW of Sandgerdi, Iceland | usgs.gov |
| 7/1/15 | 2:23 AM | 4.4 | 29.9 km | 10,000 m | 26km W of Sandgerdi, Iceland | usgs.gov |
| 6/11/15 | 3:08 AM | 4.5 | 17.5 km | 10,480 m | 13km SW of Keflavik, Iceland | usgs.gov |
| 10/13/13 | 7:34 AM | 4.8 | 38 km | 10,000 m | 17km SW of Grindavik, Iceland | usgs.gov |
| 5/10/13 | 1:06 AM | 4.1 | 41.6 km | 10,000 m | 35km WSW of Grindavik, Iceland | usgs.gov |
| 5/9/13 | 7:20 PM | 4.6 | 40.9 km | 10,000 m | 33km WSW of Grindavik, Iceland | usgs.gov |
| 5/9/13 | 5:10 PM | 4.5 | 32.5 km | 10,000 m | 69km WSW of Grindavik, Iceland | usgs.gov |
Garður
Sveitarfélagið Garður is a municipality and town located in southwestern Iceland, bordered by the Faxaflói Bay on the Southern Peninsula. town Gardur, which means garden or yard, was named after one of the many earthen walls once erected on the boun..
Garður Wikipedia Page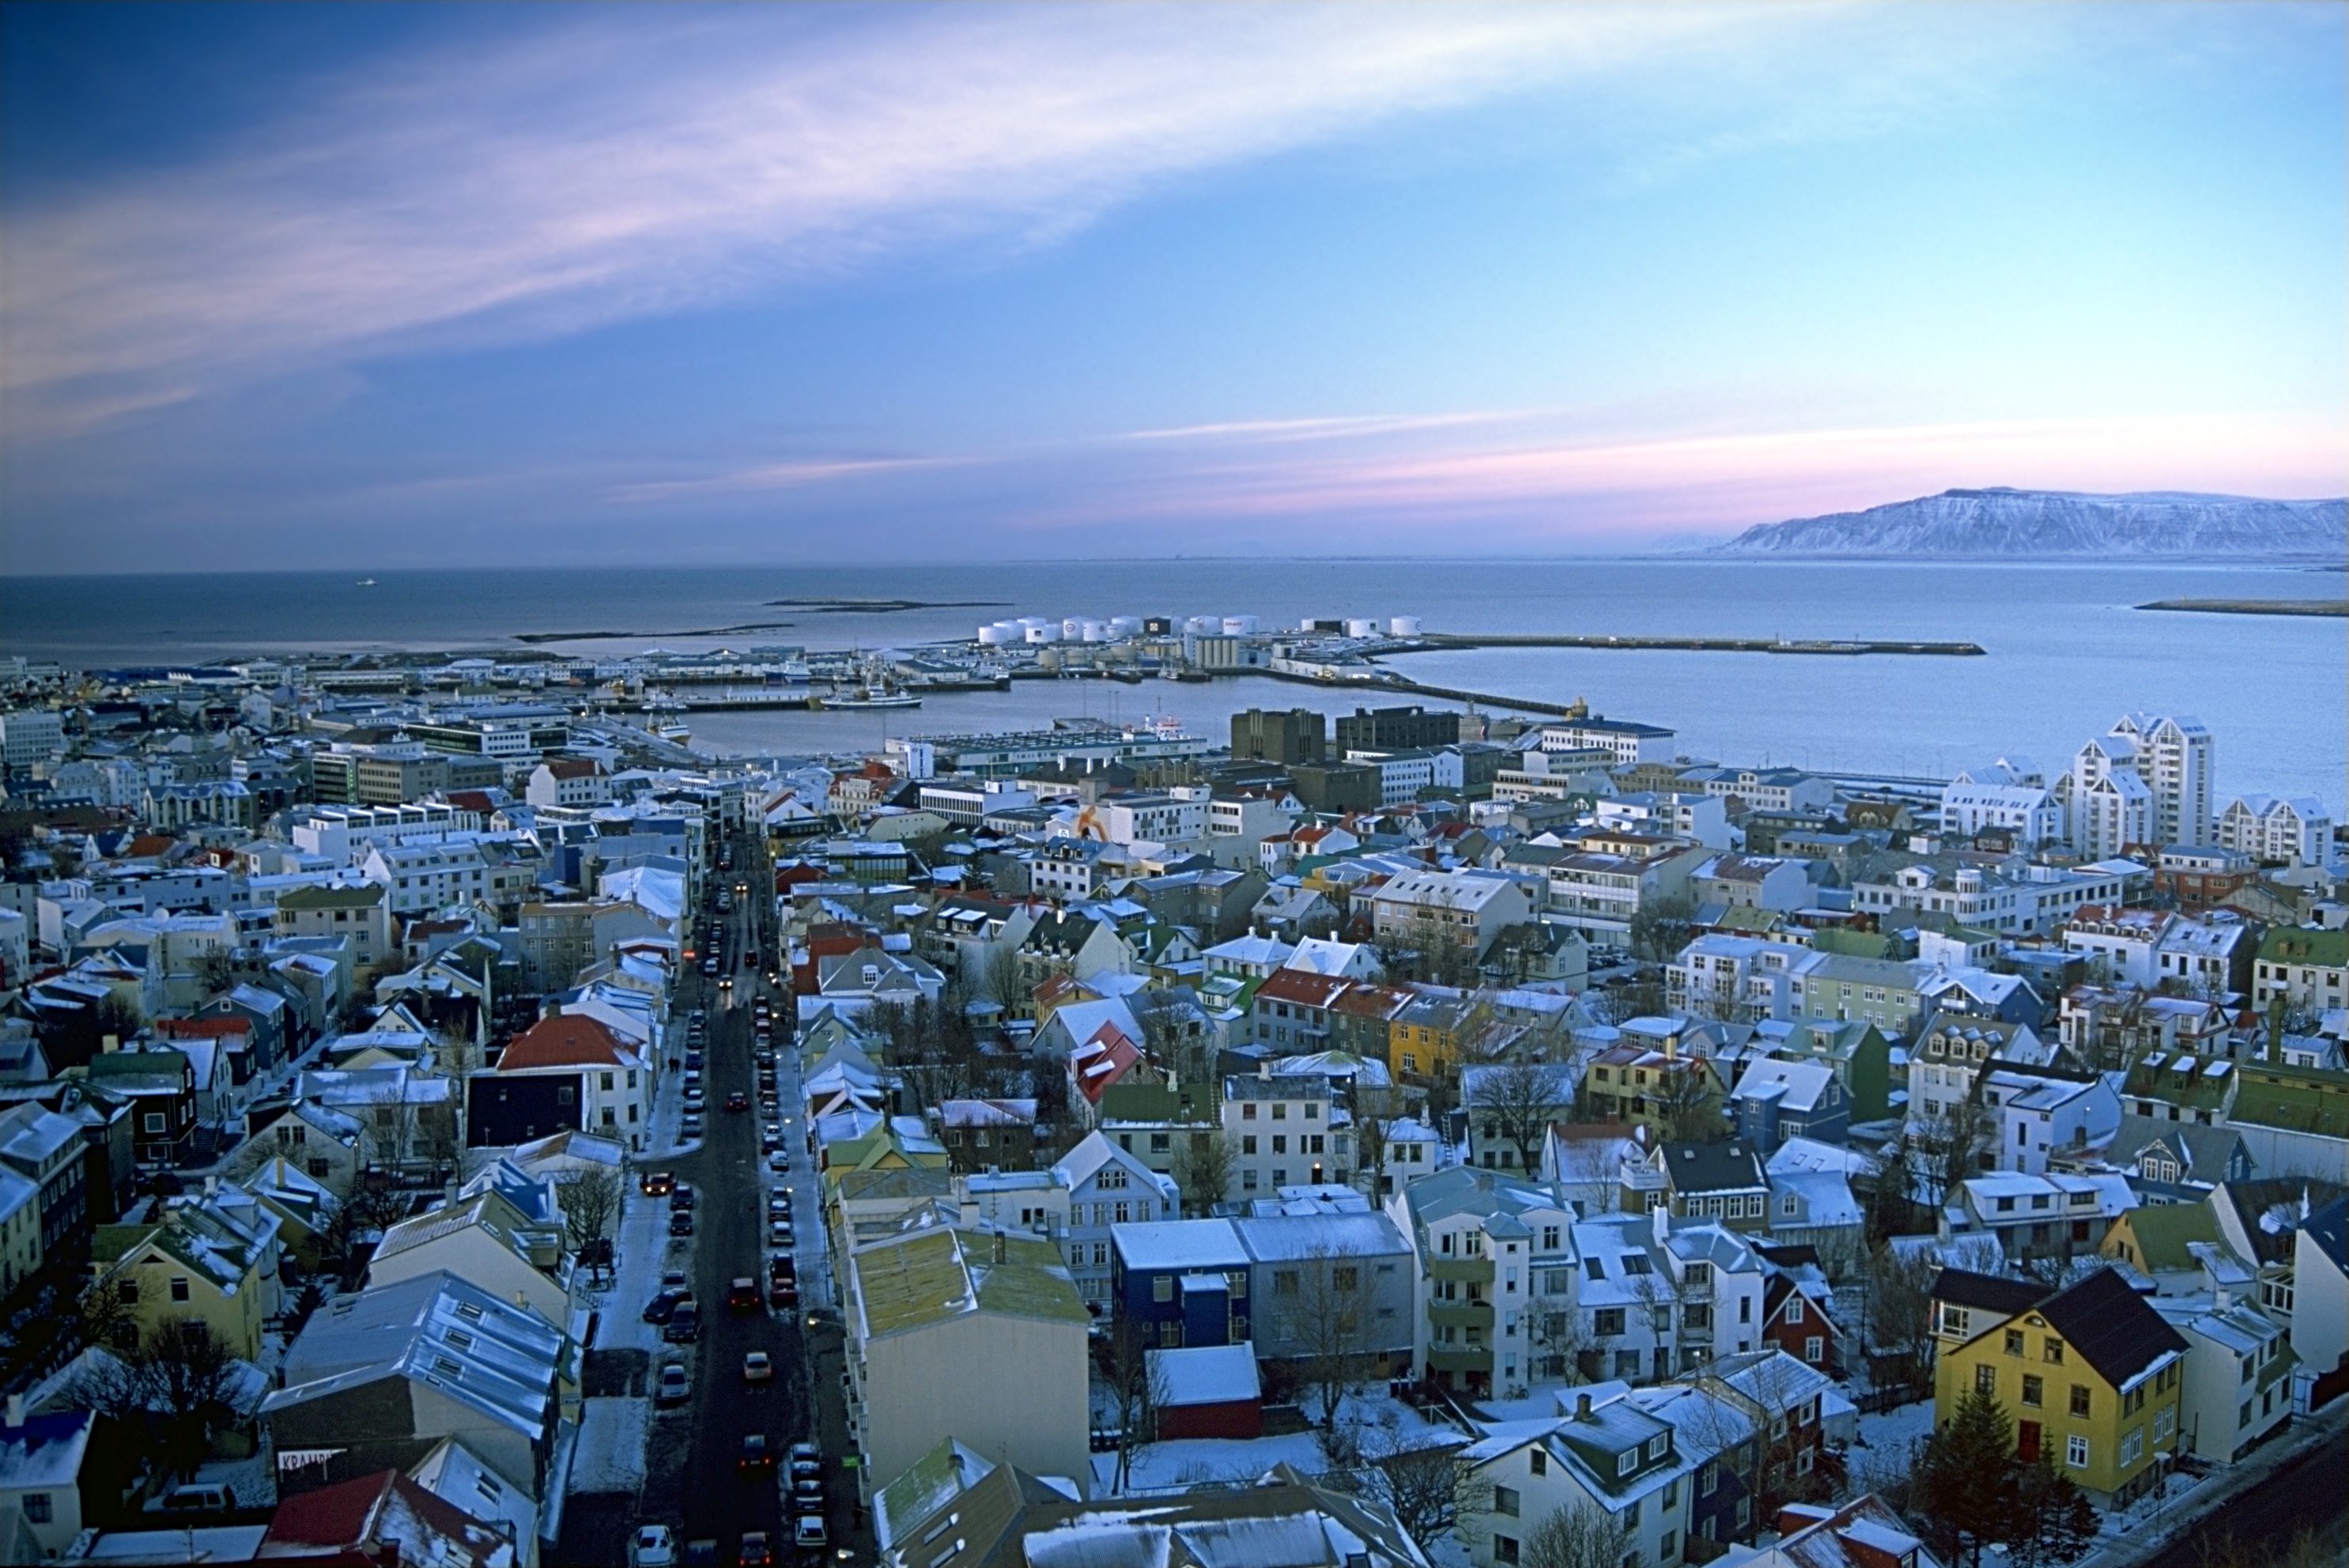


About Our Data
The data on this page is estimated using a number of publicly available tools and resources. It is provided without warranty, and could contain inaccuracies. Use at your own risk.