Industries
Business Distribution by Industry in Blera
| Industry Description | Number of Establishments |
|---|---|
| Corporate management | 12 |
| Other accommodation | 9 |
| Museums | 8 |
| Shopping | 8 |
| Restaurants | 8 |
| Grocery stores and supermarkets | 8 |
| All food and beverage | 6 |
| Household appliances and goods | 5 |
| Clothing stores | 5 |
| Bars, pubs and taverns | 5 |
| Public administration | 5 |
| Hairdressers | 5 |
| Travel agencies | 5 |
Blera Facts
| Area | 0.4 km² |
| Population | 2,907 |
| Male Population | 1,442 (49.6%) |
| Female Population | 1,465 (50.4%) |
| Population change (1975 to 2020) | +39.3% |
| Population change (2000 to 2020) | +29.7% |
| Median Age | 41.9 years (Male: 42, Female: 41.8) |
| GDP per capita (PPP) | $31,902 (2022) |
| Local Time | |
| Timezone | Central European Summer Time |
| Lat & Lng | 42.27293, 12.03016 |
Map of Blera
Interactive Map
Blera Population
Years 1975 to 2030
| Data | 1975 | 1990 | 2000 | 2015 | 2020 | 2025* | 2030* |
|---|---|---|---|---|---|---|---|
| Population | 2,087 | 2,214 | 2,242 | 2,356 | 2,907 | 2,827 | 2,731 |
| Population Density | 5,565.3 / km² | 5,904 / km² | 5,978.7 / km² | 6,282.7 / km² | 7,752 / km² | 7,538.7 / km² | 7,282.7 / km² |
Blera Population change from 2000 to 2020
Increase of 29.7% from year 2000 to 2020
| Location | Change since 1975 | Change since 1990 | Change since 2000 |
|---|---|---|---|
| Blera | +39.3% | +31.3% | +29.7% |
| Italy | — | — | — |
Blera Median Age
Median Age: 41.9 years
| Location | Median Age | Median Age (Female) | Median Age (Male) |
|---|---|---|---|
| Blera | 41.9 yrs | 41.8 yrs | 42 yrs |
| Italy | 40.9 yrs | 41.5 yrs | 40.3 yrs |
Blera Population Density
Population Density: 7,752 / km²
| Location | Population | Area | Density |
|---|---|---|---|
| Blera | 2,907 | 0.375 km² | 7,752 / km² |
| Italy | 59.3 million | 301,510.7 km² | 197 / km² |
Blera Historical and Projected Population
Estimated Population from 0 to 2100
- JRC (European Commission's Joint Research Centre) work on the GHS built-up grid
- CIESIN (Center for International Earth Science Information Network)
- [Link] Klein Goldewijk, K., Beusen, A., Doelman, J., and Stehfest, E.: Anthropogenic land use estimates for the Holocene – HYDE 3.2, Earth Syst. Sci. Data, 9, 927–953, https://doi.org/10.5194/essd-9-927-2017, 2017.
Area Codes
Percentage Area Codes used by businesses in Blera
Price Distribution
Business distribution by price for Blera
Human Development Index (HDI)
Statistic composite index of life expectancy, education, and per capita income.
Blera Gross Domestic Product (GDP)
GDP per capita, PPP (constant 2017 international $)
| Data | 1990 | 1995 | 2000 | 2005 | 2010 | 2015 | 2020 | 2022 |
|---|---|---|---|---|---|---|---|---|
| GDP per capita | $30,173 | $32,094 | $35,444 | $36,356 | $32,949 | $29,724 | $28,200 | $31,902 |
| Total GDP | $33.2M | $36.3M | $41.5M | $45.4M | $44.1M | $40.3M | $36.9M | $41.2M |
Blera CO2 Emissions
Carbon Dioxide (CO2) Emissions Per Capita in Tonnes Per Year
| Location | CO2 Emissions | CO2 Emissions Per Capita | CO2 Emissions Intensity |
|---|---|---|---|
| Blera | 18,305 tn | 6.3 tn | 48,812.4 tons/km² |
| Italy | 399,008,505 tn | 6.73 tn | 1,323.4 tons/km² |
| 2013 CO2 emissions (tonnes/year) | 18,305 tn |
| 2013 CO2 emissions (tonnes/year) per capita | 6.3 tn |
| 2013 CO2 emissions intensity (tonnes/km²/year) | 48,812.4 tons/km² |
Natural Hazards Risk
Relative risk out of 10
| Hazard | Risk Level |
|---|---|
| Earthquake | Medium (4) |
| Landslide | Medium (6) |
* Risk, particularly concerning flood or landslide, may not be for the entire area.
- Dilley, M., R.S. Chen, U. Deichmann, A.L. Lerner-Lam, M. Arnold, J. Agwe, P. Buys, O. Kjekstad, B. Lyon, and G. Yetman. 2005. Natural Disaster Hotspots: A Global Risk Analysis. Washington, D.C.: World Bank. https://doi.org/10.1596/0-8213-5930-4.
- Center for Hazards and Risk Research - CHRR - Columbia University, Center for International Earth Science Information Network - CIESIN - Columbia University, and Norwegian Geotechnical Institute - NGI. 2005. Global Landslide Hazard Distribution. Palisades, NY: NASA Socioeconomic Data and Applications Center (SEDAC). https://doi.org/10.7927/H4P848VZ.
- Center for Hazards and Risk Research - CHRR - Columbia University, Center for International Earth Science Information Network - CIESIN - Columbia University. 2005. Global Earthquake Hazard Distribution - Peak Ground Acceleration. Palisades, NY: NASA Socioeconomic Data and Applications Center (SEDAC). https://doi.org/10.7927/H4BZ63ZS.
Recent Nearby Earthquakes
Magnitude 3.0 and greater
| Date▼ | Time↕ | Magnitude↕ | Distance↕ | Depth↕ | Location↕ | Link |
|---|---|---|---|---|---|---|
| 6/23/19 | 8:43 PM | 3.4 | 76.2 km | 12,600 m | 1km N of Colonna, Italy | usgs.gov |
| 6/15/19 | 5:31 PM | 3 | 73.2 km | 11,830 m | 4km SSW of Cetona, Italy | usgs.gov |
| 1/2/17 | 3:36 AM | 4.3 | 81.9 km | 10,000 m | 4km SW of Campello sul Clitunno, Italy | usgs.gov |
| 5/30/16 | 8:24 PM | 4.4 | 48.9 km | 15,000 m | 1km WNW of Castel Giorgio, Italy | usgs.gov |
| 7/13/11 | 9:55 AM | 3.6 | 60 km | 7,600 m | central Italy | usgs.gov |
| 7/10/11 | 6:13 PM | 3.2 | 39.9 km | 2,600 m | central Italy | usgs.gov |
| 8/28/10 | 7:08 AM | 4.3 | 82 km | 8,200 m | central Italy | usgs.gov |
| 12/15/09 | 1:11 PM | 4.3 | 83.9 km | 9,200 m | central Italy | usgs.gov |
| 4/12/08 | 5:44 AM | 3.7 | 71.1 km | 14,100 m | southern Italy | usgs.gov |
| 7/6/06 | 9:47 PM | 3.2 | 41.9 km | 3,100 m | central Italy | usgs.gov |
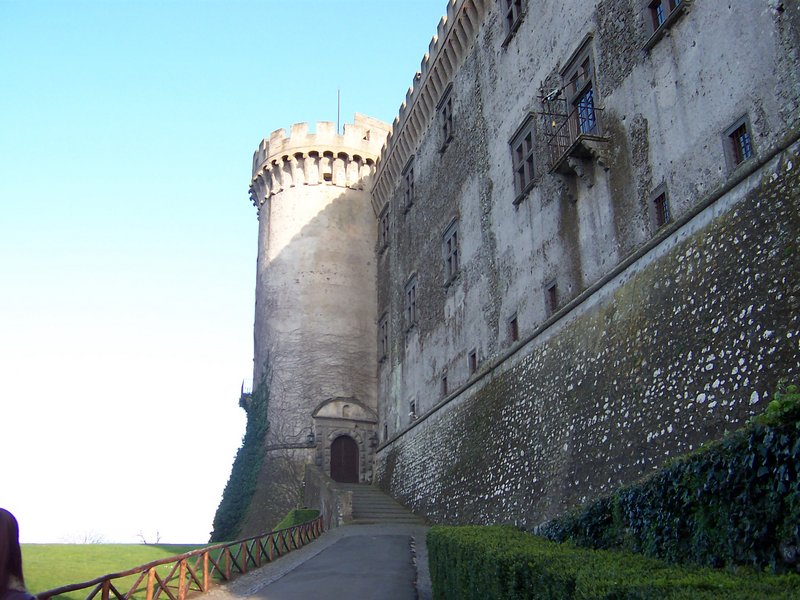
Blera
Blera is a small town and comune in the northern Lazio region of Italy near Rome, known during the Middle Ages as Bieda, an evolved form of its ancient name, which was restored in the twentieth century. It is the birthplace of Pope Sabinian; Pope Pas..
Blera Wikipedia Page


About Our Data
The data on this page is estimated using a number of publicly available tools and resources. It is provided without warranty, and could contain inaccuracies. Use at your own risk.