Categories in Cino
Cino Facts
| Area | 6.0 km² |
| Population | 383 |
| Male Population | 209 (54.6%) |
| Female Population | 174 (45.4%) |
| Population change (1975 to 2020) | +44.5% |
| Population change (2000 to 2020) | +15.0% |
| Median Age | 39.5 years (Male: 38.2, Female: 41.2) |
| Local Time | |
| Timezone | Central European Summer Time |
| Lat & Lng | 46.15843, 9.48534 |
Map of Cino
Interactive Map
Cino Population
Years 1975 to 2020
| Data | 1975 | 1990 | 2000 | 2015 | 2020 |
|---|---|---|---|---|---|
| Population | 265 | 307 | 333 | 385 | 383 |
| Population Density | 44.2 / km² | 51.2 / km² | 55.5 / km² | 64.2 / km² | 63.8 / km² |
Cino Population change from 2000 to 2015
Increase of 15.6% from year 2000 to 2015
| Location | Change since 1975 | Change since 1990 | Change since 2000 |
|---|---|---|---|
| Cino | +45.3% | +25.4% | +15.6% |
| Italy | +8.3% | +4.9% | +4.7% |
Cino Median Age
Median Age: 39.5 years
| Location | Median Age | Median Age (Female) | Median Age (Male) |
|---|---|---|---|
| Cino | 39.5 yrs | 41.2 yrs | 38.2 yrs |
| Italy | 40.9 yrs | 41.5 yrs | 40.3 yrs |
Cino Population Density
Population Density: 63.8 / km²
| Location | Population | Area | Density |
|---|---|---|---|
| Cino | 383 | 6 km² | 63.8 / km² |
| Italy | 59.3 million | 301,510.7 km² | 197 / km² |
Cino Historical and Projected Population
Estimated Population from 0 to 2100
- JRC (European Commission's Joint Research Centre) work on the GHS built-up grid
- CIESIN (Center for International Earth Science Information Network)
- [Link] Klein Goldewijk, K., Beusen, A., Doelman, J., and Stehfest, E.: Anthropogenic land use estimates for the Holocene – HYDE 3.2, Earth Syst. Sci. Data, 9, 927–953, https://doi.org/10.5194/essd-9-927-2017, 2017.
Human Development Index (HDI)
Statistic composite index of life expectancy, education, and per capita income.
Cino CO2 Emissions
Carbon Dioxide (CO2) Emissions Per Capita in Tonnes Per Year
| Location | CO2 Emissions | CO2 Emissions Per Capita | CO2 Emissions Intensity |
|---|---|---|---|
| Cino | 2,966 tn | 7.74 tn | 494.4 tons/km² |
| Italy | 399,008,505 tn | 6.73 tn | 1,323.4 tons/km² |
| 2013 CO2 emissions (tonnes/year) | 2,966 tn |
| 2013 CO2 emissions (tonnes/year) per capita | 7.74 tn |
| 2013 CO2 emissions intensity (tonnes/km²/year) | 494.4 tons/km² |
Natural Hazards Risk
Relative risk out of 10
| Hazard | Risk Level |
|---|---|
| Flood | High (9) |
| Earthquake | Medium (4) |
* Risk, particularly concerning flood or landslide, may not be for the entire area.
- Dilley, M., R.S. Chen, U. Deichmann, A.L. Lerner-Lam, M. Arnold, J. Agwe, P. Buys, O. Kjekstad, B. Lyon, and G. Yetman. 2005. Natural Disaster Hotspots: A Global Risk Analysis. Washington, D.C.: World Bank. https://doi.org/10.1596/0-8213-5930-4.
- Center for Hazards and Risk Research - CHRR - Columbia University, Center for International Earth Science Information Network - CIESIN - Columbia University. 2005. Global Flood Hazard Frequency and Distribution. Palisades, NY: NASA Socioeconomic Data and Applications Center (SEDAC). https://doi.org/10.7927/H4668B3D.
- Center for Hazards and Risk Research - CHRR - Columbia University, Center for International Earth Science Information Network - CIESIN - Columbia University. 2005. Global Earthquake Hazard Distribution - Peak Ground Acceleration. Palisades, NY: NASA Socioeconomic Data and Applications Center (SEDAC). https://doi.org/10.7927/H4BZ63ZS.
Recent Nearby Earthquakes
Magnitude 3.0 and greater
| Date▼ | Time↕ | Magnitude↕ | Distance↕ | Depth↕ | Location↕ | Link |
|---|---|---|---|---|---|---|
| 11/28/15 | 9:29 PM | 3 | 47.3 km | 5,000 m | 2km N of Albino, Italy | usgs.gov |
| 12/12/13 | 12:59 AM | 3.6 | 99.7 km | 2,600 m | 1km SSW of Balzers, Liechtenstein | usgs.gov |
| 5/11/10 | 2:13 AM | 3.3 | 48.9 km | 3,400 m | northern Italy | usgs.gov |
| 12/13/08 | 6:02 AM | 3.3 | 58.1 km | 1,000 m | northern Italy | usgs.gov |
| 11/9/08 | 7:22 AM | 3.7 | 73.8 km | 3,600 m | Switzerland | usgs.gov |
| 4/17/08 | 1:07 AM | 3.4 | 71.7 km | 5,200 m | Switzerland | usgs.gov |
| 1/21/08 | 4:40 PM | 4.2 | 67.3 km | 8,000 m | Switzerland | usgs.gov |
| 12/5/07 | 4:34 PM | 3.2 | 93 km | 3,300 m | northern Italy | usgs.gov |
| 9/17/07 | 6:43 PM | 3.3 | 85.7 km | 36,000 m | northern Italy | usgs.gov |
| 3/23/07 | 5:01 AM | 3.7 | 57.5 km | 9,700 m | northern Italy | usgs.gov |
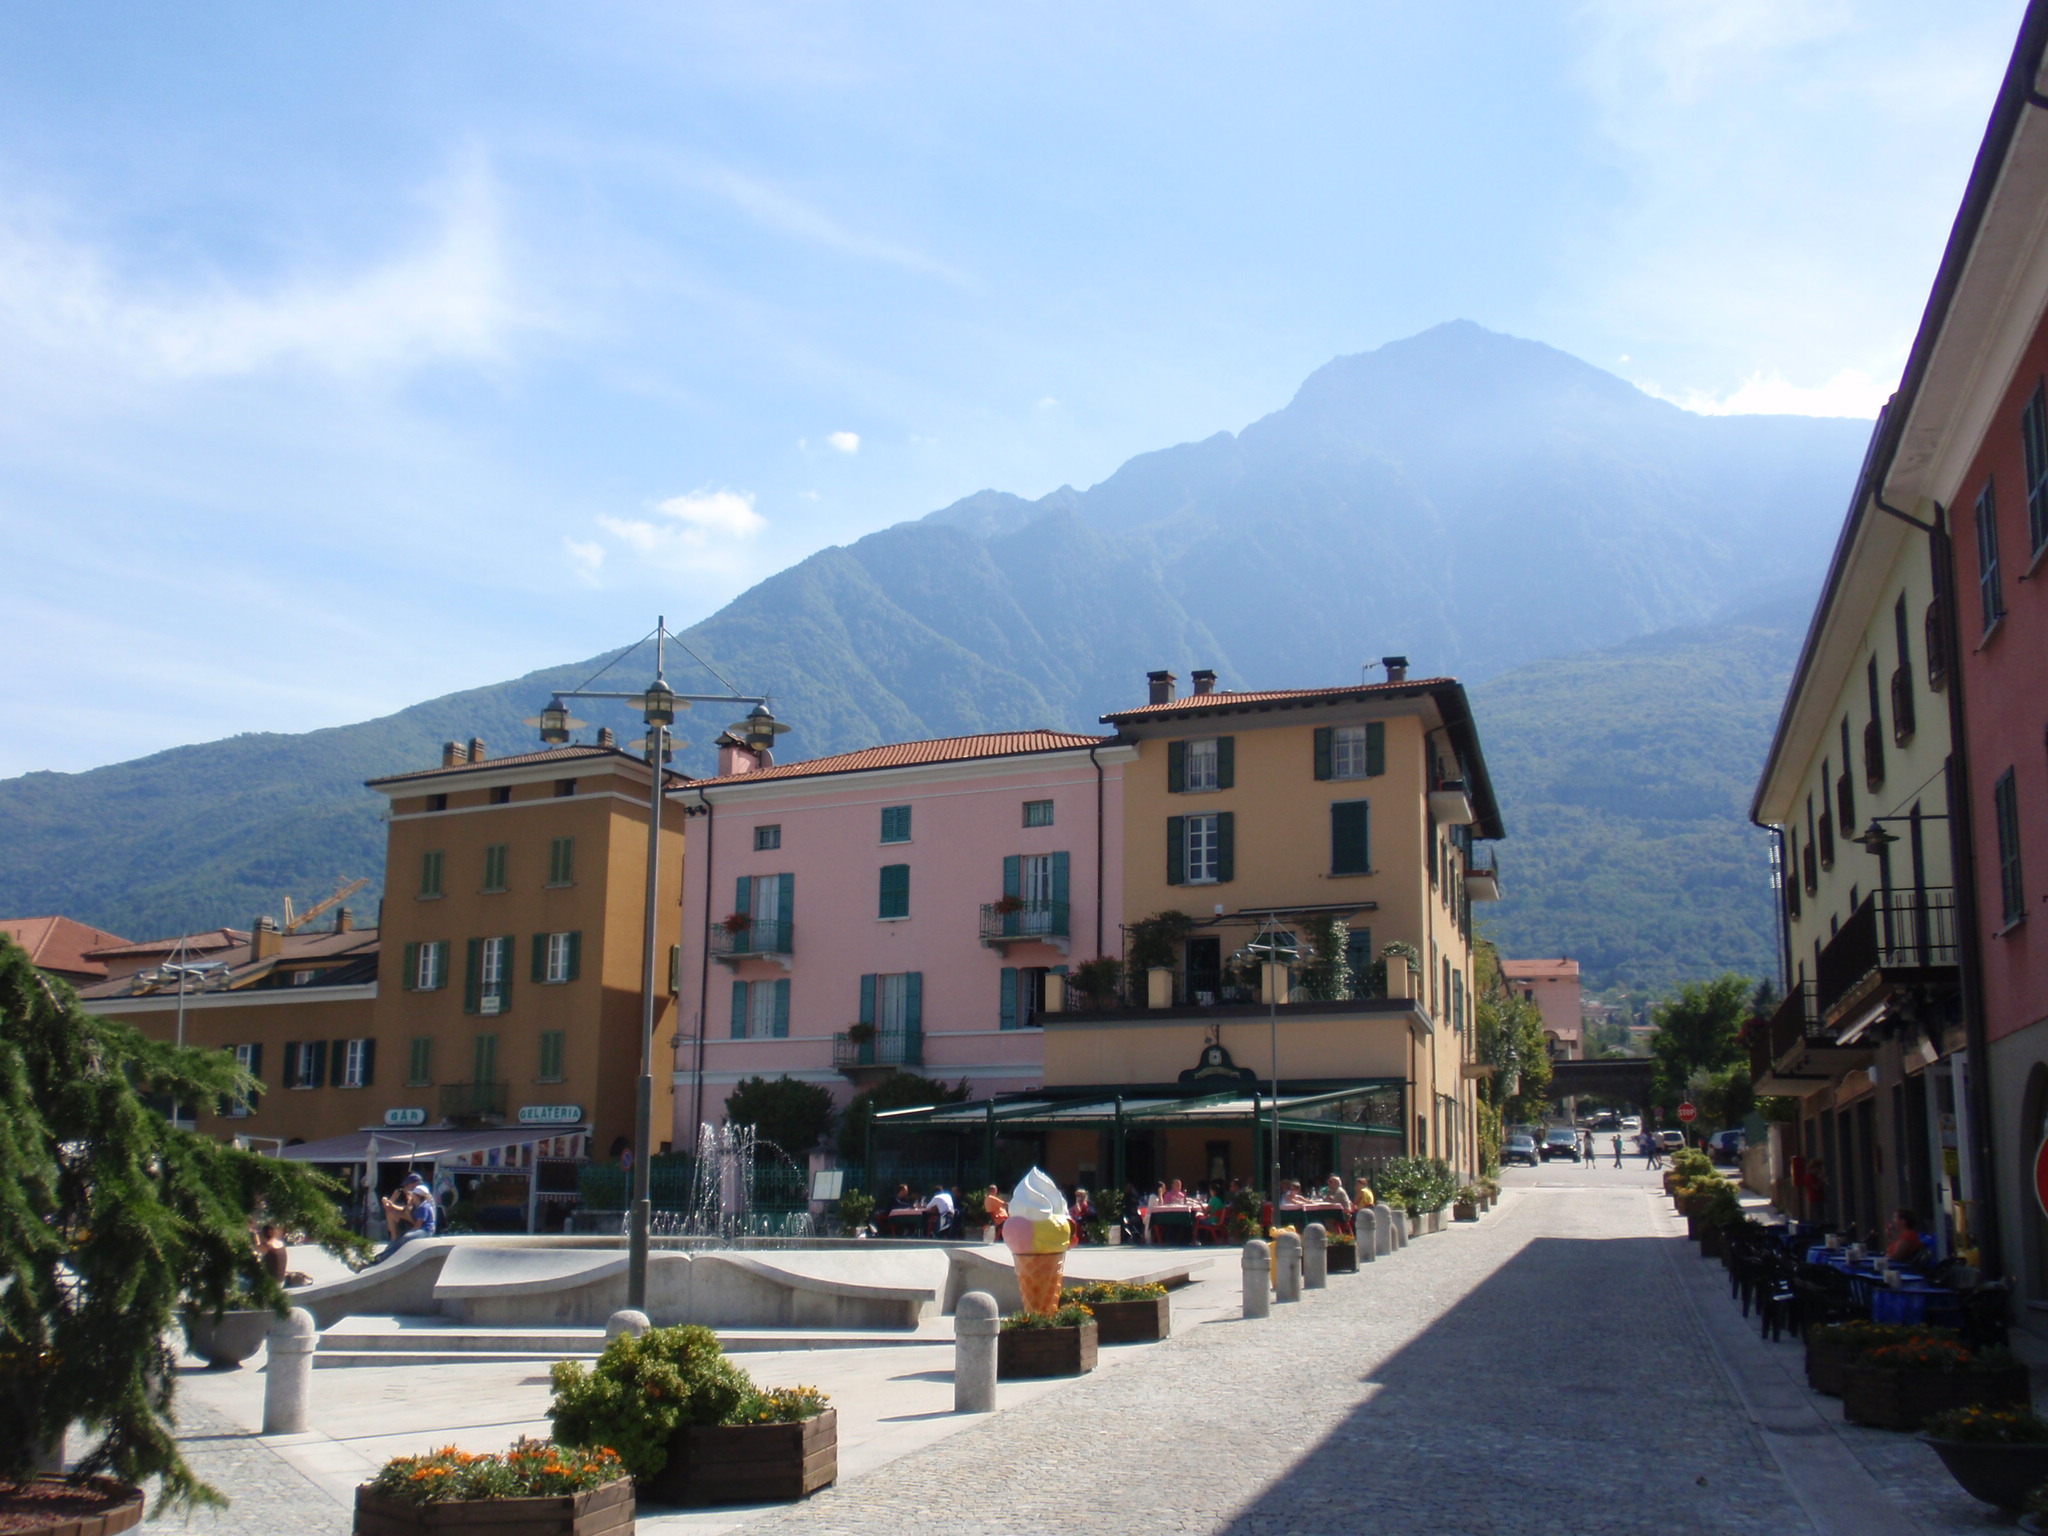
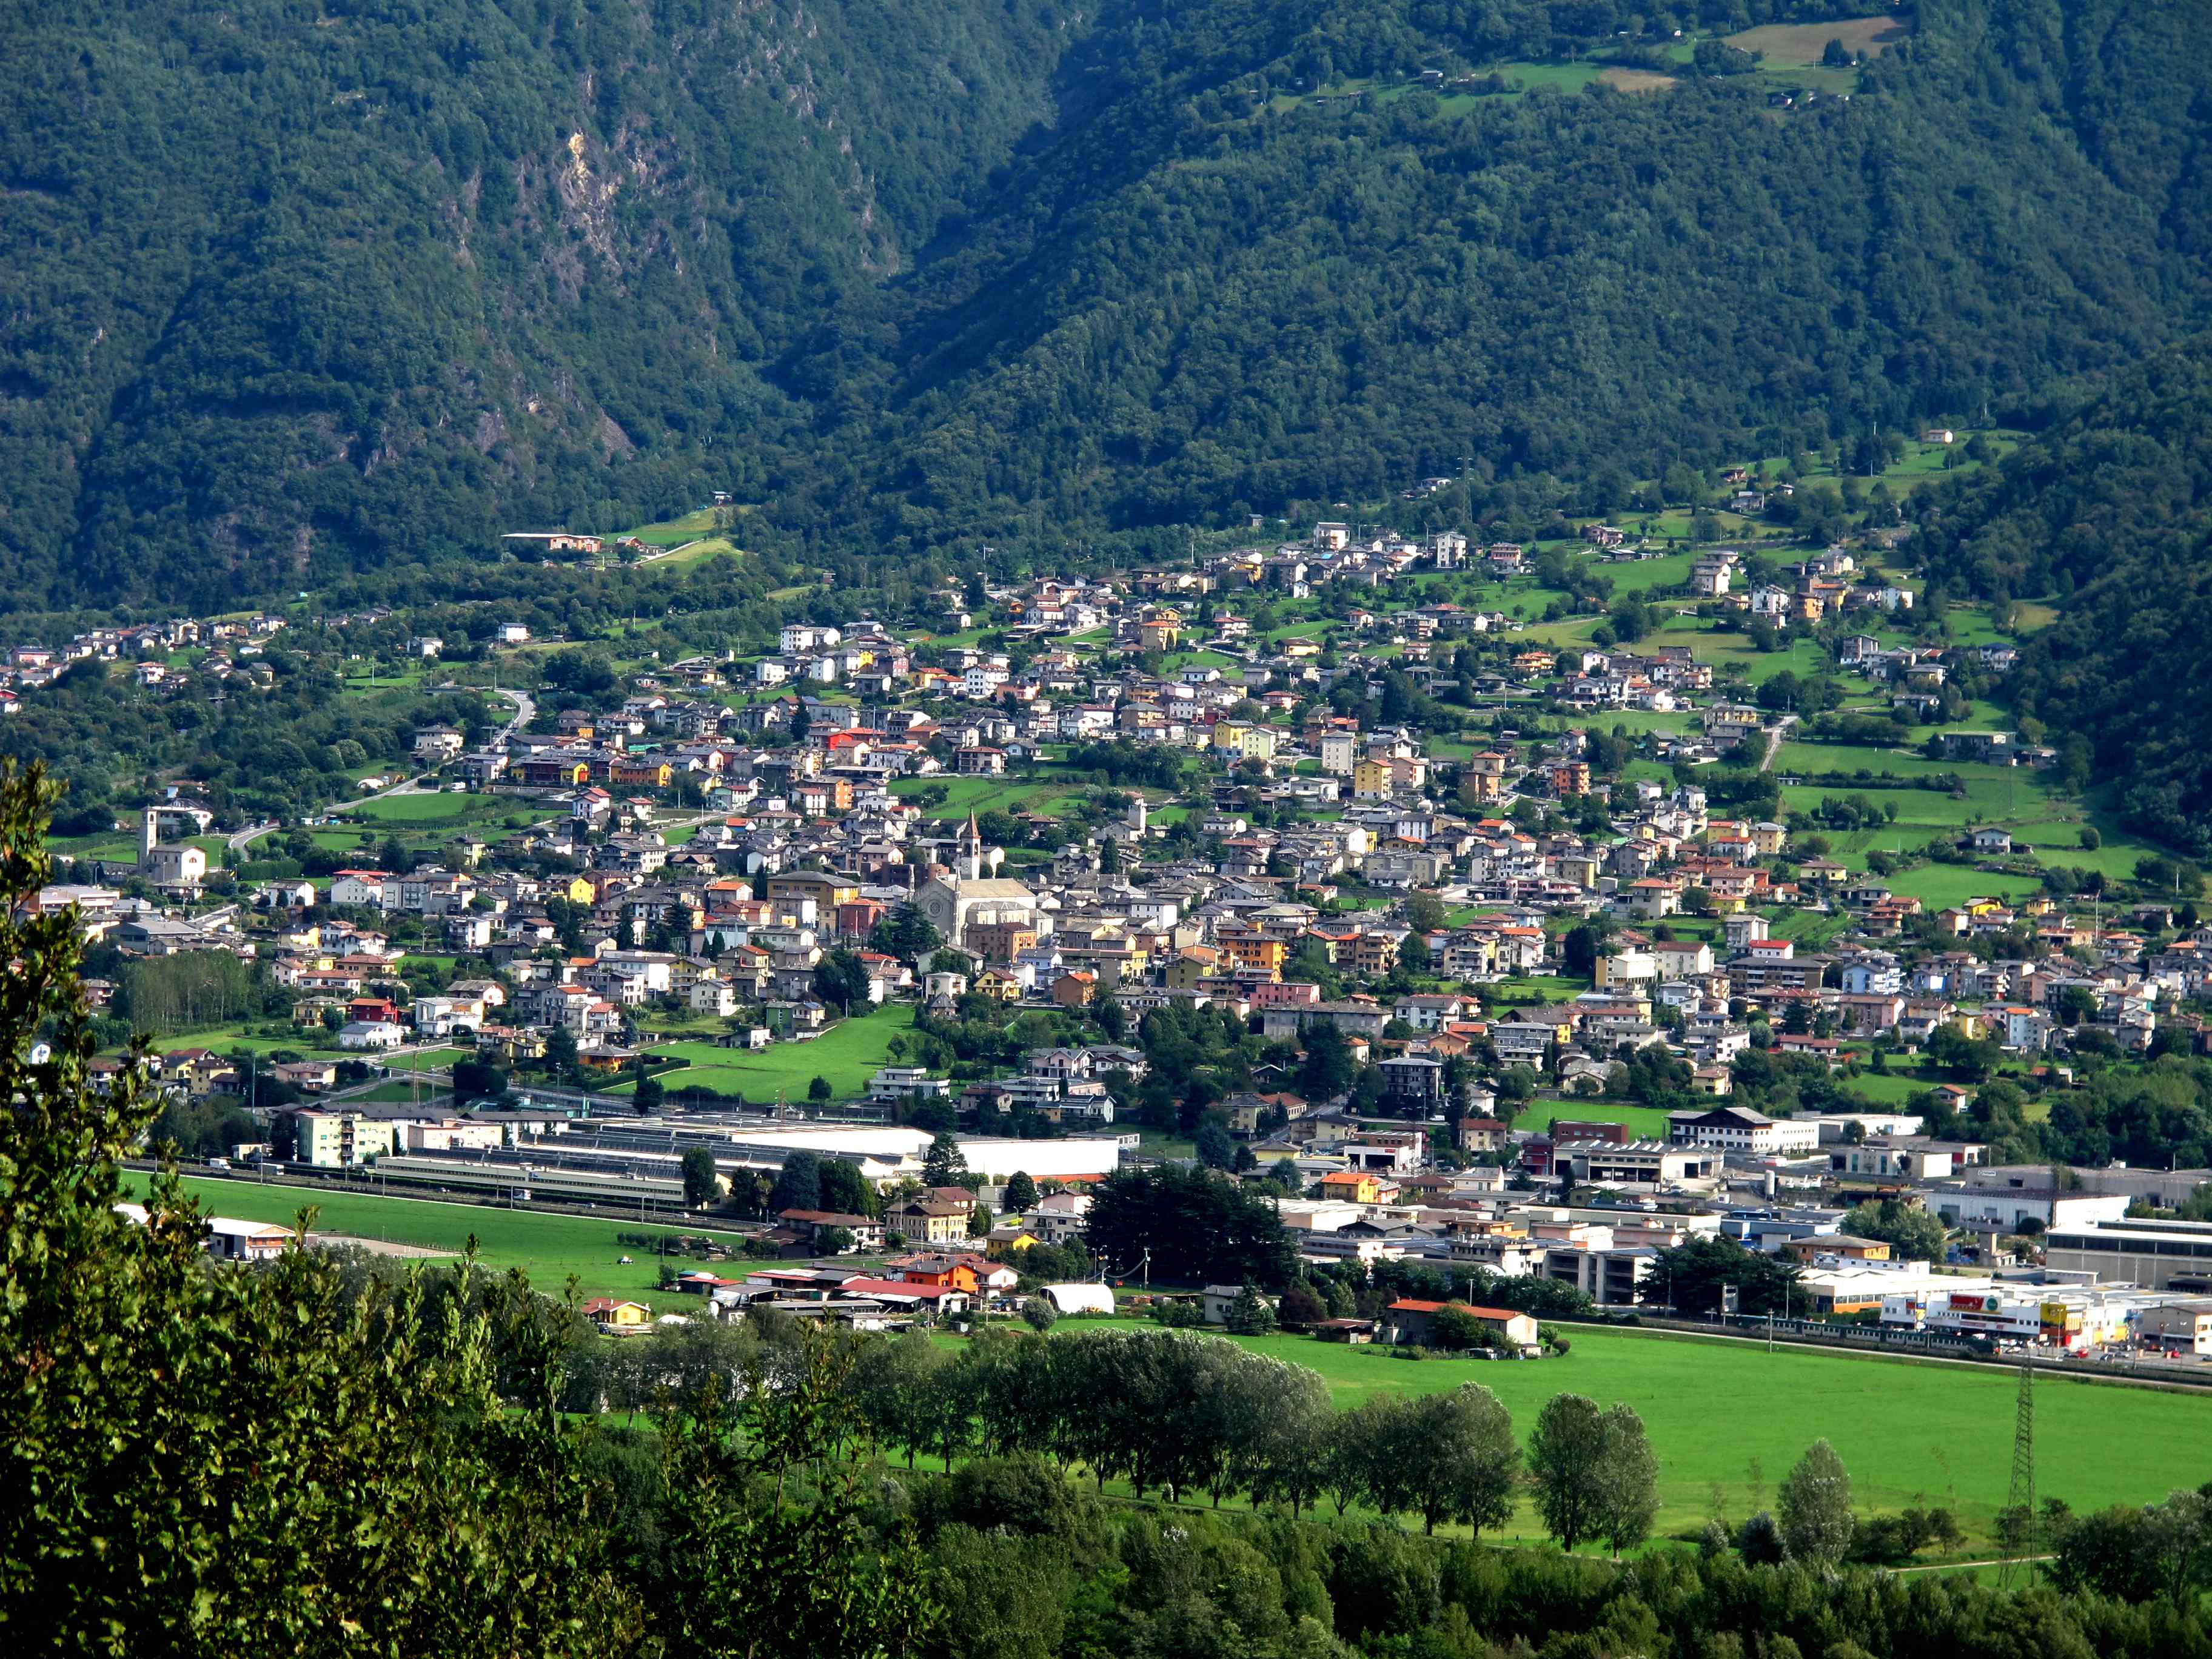
Cino
Cino is a comune in the province of Sondrio in Italy, and it has a population of about 400 inhabitants, with an area of 5 square kilometres (1.9 sq mi), the density is 67 hab/km² . Cino borders the following municipalities: Cercino, Mantello, Novate ..
Cino Wikipedia Page
About Our Data
The data on this page is estimated using a number of publicly available tools and resources. It is provided without warranty, and could contain inaccuracies. Use at your own risk.