Categories in Eboli
Industries
Business Distribution by Industry in Eboli
| Industry Description | Number of Establishments |
|---|---|
| Shopping | 243 |
| Restaurants | 146 |
| Bars, pubs and taverns | 128 |
| Clothing stores | 119 |
| Grocery stores and supermarkets | 117 |
| Corporate management | 109 |
| All food and beverage | 79 |
| Lawyers legal | 79 |
| Car repair | 66 |
| Tractors and farm equipment | 59 |
| Health and medical | 51 |
Eboli Facts
| Area | 2.7 km² |
| Population | 15,374 |
| Male Population | 7,396 (48.1%) |
| Female Population | 7,978 (51.9%) |
| Population change (1975 to 2020) | -14.8% |
| Population change (2000 to 2020) | -24.4% |
| Median Age | 39.3 years (Male: 38, Female: 40.5) |
| Neighborhoods | Murri, Posillipo |
| Local Time | |
| Timezone | Central European Summer Time |
| Lat & Lng | 40.61747, 15.05693 |
Map of Eboli
Interactive Map
Eboli Population
Years 1975 to 2030
| Data | 1975 | 1990 | 2000 | 2015 | 2020 | 2025* | 2030* |
|---|---|---|---|---|---|---|---|
| Population | 18,043 | 19,697 | 20,328 | 21,955 | 15,374 | 14,515 | 13,645 |
| Population Density | 6,713.7 / km² | 7,329.1 / km² | 7,563.9 / km² | 8,169.3 / km² | 5,720.6 / km² | 5,400.9 / km² | 5,077.2 / km² |
Eboli Population change from 2000 to 2020
Decrease of 24.4% from year 2000 to 2020
| Location | Change since 1975 | Change since 1990 | Change since 2000 |
|---|---|---|---|
| Eboli | -14.8% | -21.9% | -24.4% |
| Italy | — | — | — |
Eboli Median Age
Median Age: 39.3 years
| Location | Median Age | Median Age (Female) | Median Age (Male) |
|---|---|---|---|
| Eboli | 39.3 yrs | 40.5 yrs | 38 yrs |
| Italy | 40.9 yrs | 41.5 yrs | 40.3 yrs |
Eboli Population Density
Population Density: 5,721 / km²
| Location | Population | Area | Density |
|---|---|---|---|
| Eboli | 15,374 | 2.688 km² | 5,721 / km² |
| Italy | 59.3 million | 301,510.7 km² | 197 / km² |
Eboli Historical and Projected Population
Estimated Population from 0 to 2100
- JRC (European Commission's Joint Research Centre) work on the GHS built-up grid
- CIESIN (Center for International Earth Science Information Network)
- [Link] Klein Goldewijk, K., Beusen, A., Doelman, J., and Stehfest, E.: Anthropogenic land use estimates for the Holocene – HYDE 3.2, Earth Syst. Sci. Data, 9, 927–953, https://doi.org/10.5194/essd-9-927-2017, 2017.
Area Codes
Percentage Area Codes used by businesses in Eboli
Price Distribution
Business distribution by price for Eboli
Human Development Index (HDI)
Statistic composite index of life expectancy, education, and per capita income.
Eboli CO2 Emissions
Carbon Dioxide (CO2) Emissions Per Capita in Tonnes Per Year
| Location | CO2 Emissions | CO2 Emissions Per Capita | CO2 Emissions Intensity |
|---|---|---|---|
| Eboli | 71,770 tn | 4.67 tn | 26,705.1 tons/km² |
| Italy | 399,008,505 tn | 6.73 tn | 1,323.4 tons/km² |
| 2013 CO2 emissions (tonnes/year) | 71,770 tn |
| 2013 CO2 emissions (tonnes/year) per capita | 4.67 tn |
| 2013 CO2 emissions intensity (tonnes/km²/year) | 26,705.1 tons/km² |
Natural Hazards Risk
Relative risk out of 10
| Hazard | Risk Level |
|---|---|
| Earthquake | Medium (6) |
* Risk, particularly concerning flood or landslide, may not be for the entire area.
- Dilley, M., R.S. Chen, U. Deichmann, A.L. Lerner-Lam, M. Arnold, J. Agwe, P. Buys, O. Kjekstad, B. Lyon, and G. Yetman. 2005. Natural Disaster Hotspots: A Global Risk Analysis. Washington, D.C.: World Bank. https://doi.org/10.1596/0-8213-5930-4.
- Center for Hazards and Risk Research - CHRR - Columbia University, Center for International Earth Science Information Network - CIESIN - Columbia University. 2005. Global Earthquake Hazard Distribution - Peak Ground Acceleration. Palisades, NY: NASA Socioeconomic Data and Applications Center (SEDAC). https://doi.org/10.7927/H4BZ63ZS.
Recent Nearby Earthquakes
Magnitude 3.0 and greater
| Date▼ | Time↕ | Magnitude↕ | Distance↕ | Depth↕ | Location↕ | Link |
|---|---|---|---|---|---|---|
| 12/14/14 | 2:33 PM | 4.2 | 17.9 km | 299,600 m | 6km NW of Capaccio, Italy | usgs.gov |
| 1/22/14 | 10:44 PM | 4 | 19.5 km | 2,000 m | 3km NE of Capaccio, Italy | usgs.gov |
| 5/30/08 | 5:22 PM | 4.4 | 15.8 km | 309,200 m | southern Italy | usgs.gov |
| 3/24/07 | 10:31 AM | 3.3 | 3.8 km | 309,000 m | southern Italy | usgs.gov |
| 2/17/07 | 5:54 PM | 3.1 | 38.4 km | 11,100 m | southern Italy | usgs.gov |
| 10/3/06 | 11:02 PM | 3.7 | 16.5 km | 326,300 m | southern Italy | usgs.gov |
| 9/26/06 | 4:29 PM | 3 | 35.6 km | 4,600 m | southern Italy | usgs.gov |
| 2/5/06 | 5:02 PM | 3.2 | 23.5 km | 10,500 m | southern Italy | usgs.gov |
| 6/14/05 | 11:34 PM | 3 | 36.8 km | 6,400 m | southern Italy | usgs.gov |
| 12/6/04 | 7:13 AM | 3 | 33.4 km | 3,700 m | southern Italy | usgs.gov |
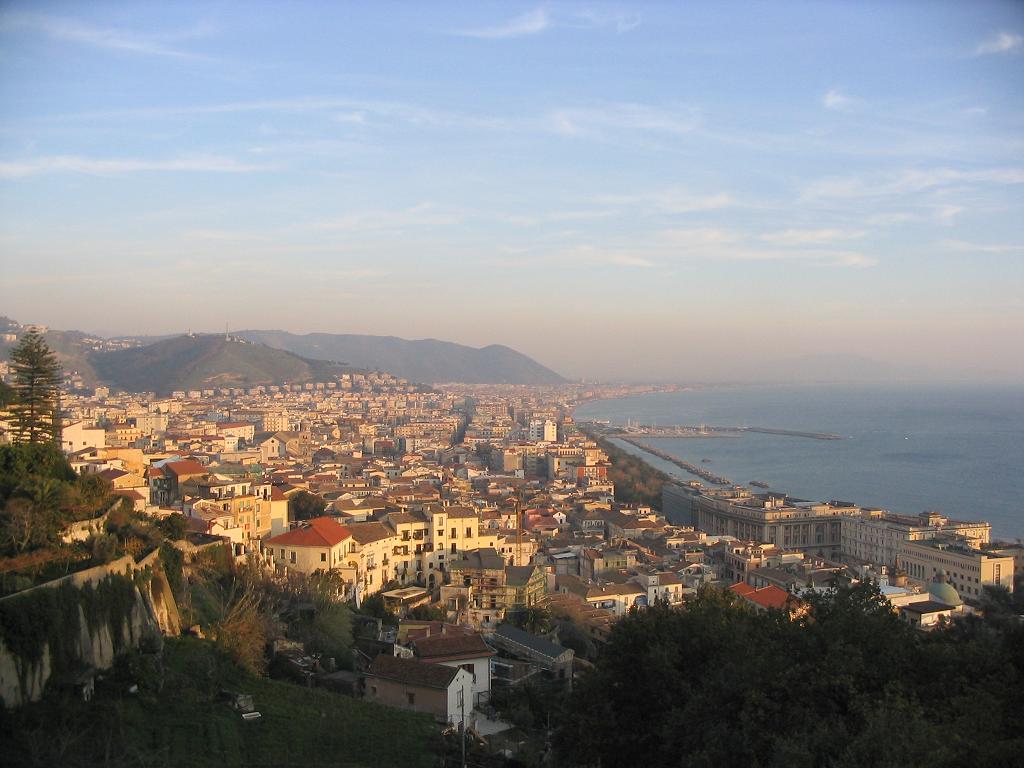
Eboli
Eboli is a town and comune of Campania, southern Italy, in the province of Salerno, on the south edge of the hills overlooking the valley of the Sele. agricultural centre, Eboli is known mainly for olive oil and for dairy products, among which the m..
Eboli Wikipedia Page


About Our Data
The data on this page is estimated using a number of publicly available tools and resources. It is provided without warranty, and could contain inaccuracies. Use at your own risk.