Categories in Gubbio
Industries
Business Distribution by Industry in Gubbio
| Industry Description | Number of Establishments | Average Google Rating |
|---|---|---|
| Shopping | 368 | 4.4 |
| Other accommodation | 154 | 4.4 |
| All food and beverage | 100 | 4.5 |
| Restaurants | 92 | 4.3 |
| Grocery stores and supermarkets | 74 | 4.5 |
| Bars, pubs and taverns | 66 | 4.3 |
| Clothing stores | 48 | 4.5 |
| Bed and breakfasts | 47 | 4.6 |
| Hotels and motels | 46 | 4.2 |
| Churches | 41 | 4.5 |
| Technical construction services | 39 | 4.4 |
| General contractors | 39 | 4.6 |
| Religion | 37 | 4.5 |
| Health and medical | 36 | 4.8 |
| Beauty salons | 34 | 4.6 |
| Travel agencies | 32 | 4.5 |
| Financial services | 32 | 4.5 |
| Italian restaurants | 29 | 4.4 |
| Construction of buildings | 27 | 4.7 |
| Hairdressers | 26 | 4.7 |
| Shopping other | 26 | 4.4 |
| Education | 26 | 4.3 |
| Loan companies | 25 | 3.7 |
| Wholesale of construction supplies | 25 | 4.5 |
| Hardware store | 25 | 4.8 |
Gubbio Facts
| Area | 3.6 km² |
| Population | 13,013 |
| Male Population | 6,361 (48.9%) |
| Female Population | 6,652 (51.1%) |
| Population change (1975 to 2020) | +2.7% |
| Population change (2000 to 2020) | +1.8% |
| Median Age | 42.3 years (Male: 41.3, Female: 43.4) |
| Local Time | |
| Timezone | Central European Summer Time |
| Lat & Lng | 43.34996, 12.57309 |
Map of Gubbio
Interactive Map
Gubbio Population
Years 1975 to 2020
| Data | 1975 | 1990 | 2000 | 2015 | 2020 |
|---|---|---|---|---|---|
| Population | 12,667 | 12,918 | 12,783 | 12,961 | 13,013 |
| Population Density | 3,555.6 / km² | 3,626.1 / km² | 3,588.2 / km² | 3,638.2 / km² | 3,652.8 / km² |
Gubbio Population change from 2000 to 2015
Increase of 1.4% from year 2000 to 2015
| Location | Change since 1975 | Change since 1990 | Change since 2000 |
|---|---|---|---|
| Gubbio | +2.3% | +0.3% | +1.4% |
| Italy | +8.3% | +4.9% | +4.7% |
Gubbio Median Age
Median Age: 42.3 years
| Location | Median Age | Median Age (Female) | Median Age (Male) |
|---|---|---|---|
| Gubbio | 42.3 yrs | 43.4 yrs | 41.3 yrs |
| Italy | 40.9 yrs | 41.5 yrs | 40.3 yrs |
Gubbio Population Density
Population Density: 3,653 / km²
| Location | Population | Area | Density |
|---|---|---|---|
| Gubbio | 13,013 | 3.563 km² | 3,653 / km² |
| Italy | 59.3 million | 301,510.7 km² | 197 / km² |
Gubbio Historical and Projected Population
Estimated Population from 0 to 2100
- JRC (European Commission's Joint Research Centre) work on the GHS built-up grid
- CIESIN (Center for International Earth Science Information Network)
- [Link] Klein Goldewijk, K., Beusen, A., Doelman, J., and Stehfest, E.: Anthropogenic land use estimates for the Holocene – HYDE 3.2, Earth Syst. Sci. Data, 9, 927–953, https://doi.org/10.5194/essd-9-927-2017, 2017.
Price Distribution
Business distribution by price for Gubbio
Human Development Index (HDI)
Statistic composite index of life expectancy, education, and per capita income.
Gubbio CO2 Emissions
Carbon Dioxide (CO2) Emissions Per Capita in Tonnes Per Year
| Location | CO2 Emissions | CO2 Emissions Per Capita | CO2 Emissions Intensity |
|---|---|---|---|
| Gubbio | 96,161 tn | 7.39 tn | 26,992.7 tons/km² |
| Italy | 399,008,505 tn | 6.73 tn | 1,323.4 tons/km² |
| 2013 CO2 emissions (tonnes/year) | 96,161 tn |
| 2013 CO2 emissions (tonnes/year) per capita | 7.39 tn |
| 2013 CO2 emissions intensity (tonnes/km²/year) | 26,992.7 tons/km² |
Natural Hazards Risk
Relative risk out of 10
| Hazard | Risk Level |
|---|---|
| Earthquake | Medium (7) |
| Landslide | Medium (6) |
* Risk, particularly concerning flood or landslide, may not be for the entire area.
- Dilley, M., R.S. Chen, U. Deichmann, A.L. Lerner-Lam, M. Arnold, J. Agwe, P. Buys, O. Kjekstad, B. Lyon, and G. Yetman. 2005. Natural Disaster Hotspots: A Global Risk Analysis. Washington, D.C.: World Bank. https://doi.org/10.1596/0-8213-5930-4.
- Center for Hazards and Risk Research - CHRR - Columbia University, Center for International Earth Science Information Network - CIESIN - Columbia University, and Norwegian Geotechnical Institute - NGI. 2005. Global Landslide Hazard Distribution. Palisades, NY: NASA Socioeconomic Data and Applications Center (SEDAC). https://doi.org/10.7927/H4P848VZ.
- Center for Hazards and Risk Research - CHRR - Columbia University, Center for International Earth Science Information Network - CIESIN - Columbia University. 2005. Global Earthquake Hazard Distribution - Peak Ground Acceleration. Palisades, NY: NASA Socioeconomic Data and Applications Center (SEDAC). https://doi.org/10.7927/H4BZ63ZS.
Recent Nearby Earthquakes
Magnitude 3.0 and greater
| Date▼ | Time↕ | Magnitude↕ | Distance↕ | Depth↕ | Location↕ | Link |
|---|---|---|---|---|---|---|
| 12/22/13 | 10:06 AM | 3.9 | 5.7 km | 8,300 m | 5km NW of Gubbio, Italy | usgs.gov |
| 6/1/08 | 12:30 PM | 3.6 | 18.3 km | 36,700 m | central Italy | usgs.gov |
| 4/27/05 | 1:08 PM | 3.8 | 15.4 km | 10,000 m | central Italy | usgs.gov |
| 7/23/04 | 1:26 AM | 3.1 | 16 km | 3,400 m | central Italy | usgs.gov |
| 11/4/02 | 2:36 AM | 3 | 14.4 km | 10,000 m | central Italy | usgs.gov |
| 9/20/02 | 9:56 PM | 3 | 16.1 km | 5,000 m | central Italy | usgs.gov |
| 9/15/02 | 10:26 AM | 3.2 | 15.5 km | 5,000 m | central Italy | usgs.gov |
| 9/8/02 | 5:55 AM | 3 | 17.2 km | 5,000 m | central Italy | usgs.gov |
| 3/24/02 | 12:04 AM | 3 | 10.8 km | 5,000 m | central Italy | usgs.gov |
| 12/27/00 | 3:55 PM | 3.3 | 14.9 km | 10,000 m | central Italy | usgs.gov |
Gubbio
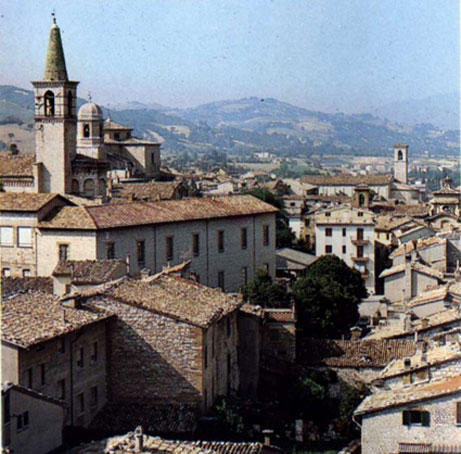
Gubbio is a town and comune in the far northeastern part of the Italian province of Perugia (Umbria). It is located on the lowest slope of Mt. Ingino, a small mountain of the Apennines.
Gubbio Wikipedia Page


About Our Data
The data on this page is estimated using a number of publicly available tools and resources. It is provided without warranty, and could contain inaccuracies. Use at your own risk.