Categories in Innichen
Industries
Business Distribution by Industry in Innichen
| Industry Description | Number of Establishments | Average Age of Business |
|---|---|---|
| Other accommodation | 128 | 30 years |
| Restaurants | 27 | — |
| Clothing stores | 25 | — |
| Shopping | 20 | — |
| Hotels and motels | 19 | — |
| Corporate management | 17 | — |
| Real estate | 15 | — |
| Travel agencies | 15 | — |
| Bars, pubs and taverns | 12 | — |
| Parking lots and garages | 11 | — |
| Grocery stores and supermarkets | 11 | — |
| Tractors and farm equipment | 9 | — |
Innichen Facts
| Area | 1.2 km² |
| Population | 559 |
| Male Population | 275 (49.2%) |
| Female Population | 284 (50.8%) |
| Population change (1975 to 2020) | -70.2% |
| Population change (2000 to 2020) | -71.3% |
| Median Age | 40.5 years (Male: 40.2, Female: 40.8) |
| GDP per capita (PPP) | $69,687 (2022) |
| Local Time | |
| Timezone | Central European Summer Time |
| Lat & Lng | 46.73240, 12.27855 |
Map of Innichen
Interactive Map
Innichen Population
Years 1975 to 2030
| Data | 1975 | 1990 | 2000 | 2015 | 2020 | 2025* | 2030* |
|---|---|---|---|---|---|---|---|
| Population | 1,877 | 1,952 | 1,948 | 1,997 | 559 | 541 | 524 |
| Population Density | 1,580.6 / km² | 1,643.8 / km² | 1,640.4 / km² | 1,681.7 / km² | 470.7 / km² | 455.6 / km² | 441.3 / km² |
Innichen Population change from 2000 to 2020
Decrease of 71.3% from year 2000 to 2020
| Location | Change since 1975 | Change since 1990 | Change since 2000 |
|---|---|---|---|
| Innichen | -70.2% | -71.4% | -71.3% |
| Italy | — | — | — |
Innichen Median Age
Median Age: 40.5 years
| Location | Median Age | Median Age (Female) | Median Age (Male) |
|---|---|---|---|
| Innichen | 40.5 yrs | 40.8 yrs | 40.2 yrs |
| Italy | 40.9 yrs | 41.5 yrs | 40.3 yrs |
Innichen Population Density
Population Density: 471 / km²
| Location | Population | Area | Density |
|---|---|---|---|
| Innichen | 559 | 1.188 km² | 471 / km² |
| Italy | 59.3 million | 301,510.7 km² | 197 / km² |
Innichen Historical and Projected Population
Estimated Population from 0 to 2100
- JRC (European Commission's Joint Research Centre) work on the GHS built-up grid
- CIESIN (Center for International Earth Science Information Network)
- [Link] Klein Goldewijk, K., Beusen, A., Doelman, J., and Stehfest, E.: Anthropogenic land use estimates for the Holocene – HYDE 3.2, Earth Syst. Sci. Data, 9, 927–953, https://doi.org/10.5194/essd-9-927-2017, 2017.
Price Distribution
Business distribution by price for Innichen
Human Development Index (HDI)
Statistic composite index of life expectancy, education, and per capita income.
Innichen Gross Domestic Product (GDP)
GDP per capita, PPP (constant 2017 international $)
| Data | 1990 | 1995 | 2000 | 2005 | 2010 | 2015 | 2020 | 2022 |
|---|---|---|---|---|---|---|---|---|
| GDP per capita | $51,592 | $54,877 | $60,606 | $60,233 | $61,784 | $63,220 | $61,599 | $69,687 |
| Total GDP | $134.8M | $146.2M | $163.4M | $166.8M | $176.4M | $177.8M | $166.6M | $186.4M |
Innichen CO2 Emissions
Carbon Dioxide (CO2) Emissions Per Capita in Tonnes Per Year
| Location | CO2 Emissions | CO2 Emissions Per Capita | CO2 Emissions Intensity |
|---|---|---|---|
| Innichen | 3,979 tn | 7.12 tn | 3,350.6 tons/km² |
| Italy | 399,008,505 tn | 6.73 tn | 1,323.4 tons/km² |
| 2013 CO2 emissions (tonnes/year) | 3,979 tn |
| 2013 CO2 emissions (tonnes/year) per capita | 7.12 tn |
| 2013 CO2 emissions intensity (tonnes/km²/year) | 3,350.6 tons/km² |
Natural Hazards Risk
Relative risk out of 10
| Hazard | Risk Level |
|---|---|
| Flood | Medium (4) |
| Earthquake | Medium (4) |
* Risk, particularly concerning flood or landslide, may not be for the entire area.
- Dilley, M., R.S. Chen, U. Deichmann, A.L. Lerner-Lam, M. Arnold, J. Agwe, P. Buys, O. Kjekstad, B. Lyon, and G. Yetman. 2005. Natural Disaster Hotspots: A Global Risk Analysis. Washington, D.C.: World Bank. https://doi.org/10.1596/0-8213-5930-4.
- Center for Hazards and Risk Research - CHRR - Columbia University, Center for International Earth Science Information Network - CIESIN - Columbia University. 2005. Global Flood Hazard Frequency and Distribution. Palisades, NY: NASA Socioeconomic Data and Applications Center (SEDAC). https://doi.org/10.7927/H4668B3D.
- Center for Hazards and Risk Research - CHRR - Columbia University, Center for International Earth Science Information Network - CIESIN - Columbia University. 2005. Global Earthquake Hazard Distribution - Peak Ground Acceleration. Palisades, NY: NASA Socioeconomic Data and Applications Center (SEDAC). https://doi.org/10.7927/H4BZ63ZS.
Recent Nearby Earthquakes
Magnitude 3.0 and greater
| Date▼ | Time↕ | Magnitude↕ | Distance↕ | Depth↕ | Location↕ | Link |
|---|---|---|---|---|---|---|
| 8/24/13 | 1:59 PM | 3.6 | 59.5 km | 9,200 m | 5km SSW of Claut, Italy | usgs.gov |
| 6/9/12 | 2:04 AM | 4.5 | 59.6 km | 7,000 m | northern Italy | usgs.gov |
| 2/26/07 | 2:16 PM | 3.8 | 55.9 km | 7,300 m | northern Italy | usgs.gov |
| 2/26/07 | 5:50 AM | 3.7 | 58.5 km | 9,400 m | northern Italy | usgs.gov |
| 12/28/06 | 2:10 PM | 4 | 70 km | 5,000 m | northern Italy | usgs.gov |
| 12/7/04 | 2:19 AM | 3.5 | 70.6 km | 5,000 m | northern Italy | usgs.gov |
| 9/27/04 | 7:01 AM | 3.1 | 54.9 km | 5,000 m | northern Italy | usgs.gov |
| 8/29/04 | 1:02 AM | 3 | 54.3 km | 5,000 m | northern Italy | usgs.gov |
| 8/29/04 | 12:04 AM | 4.3 | 59.3 km | 10,500 m | northern Italy | usgs.gov |
| 8/27/04 | 12:10 AM | 3.1 | 58.3 km | 5,000 m | northern Italy | usgs.gov |
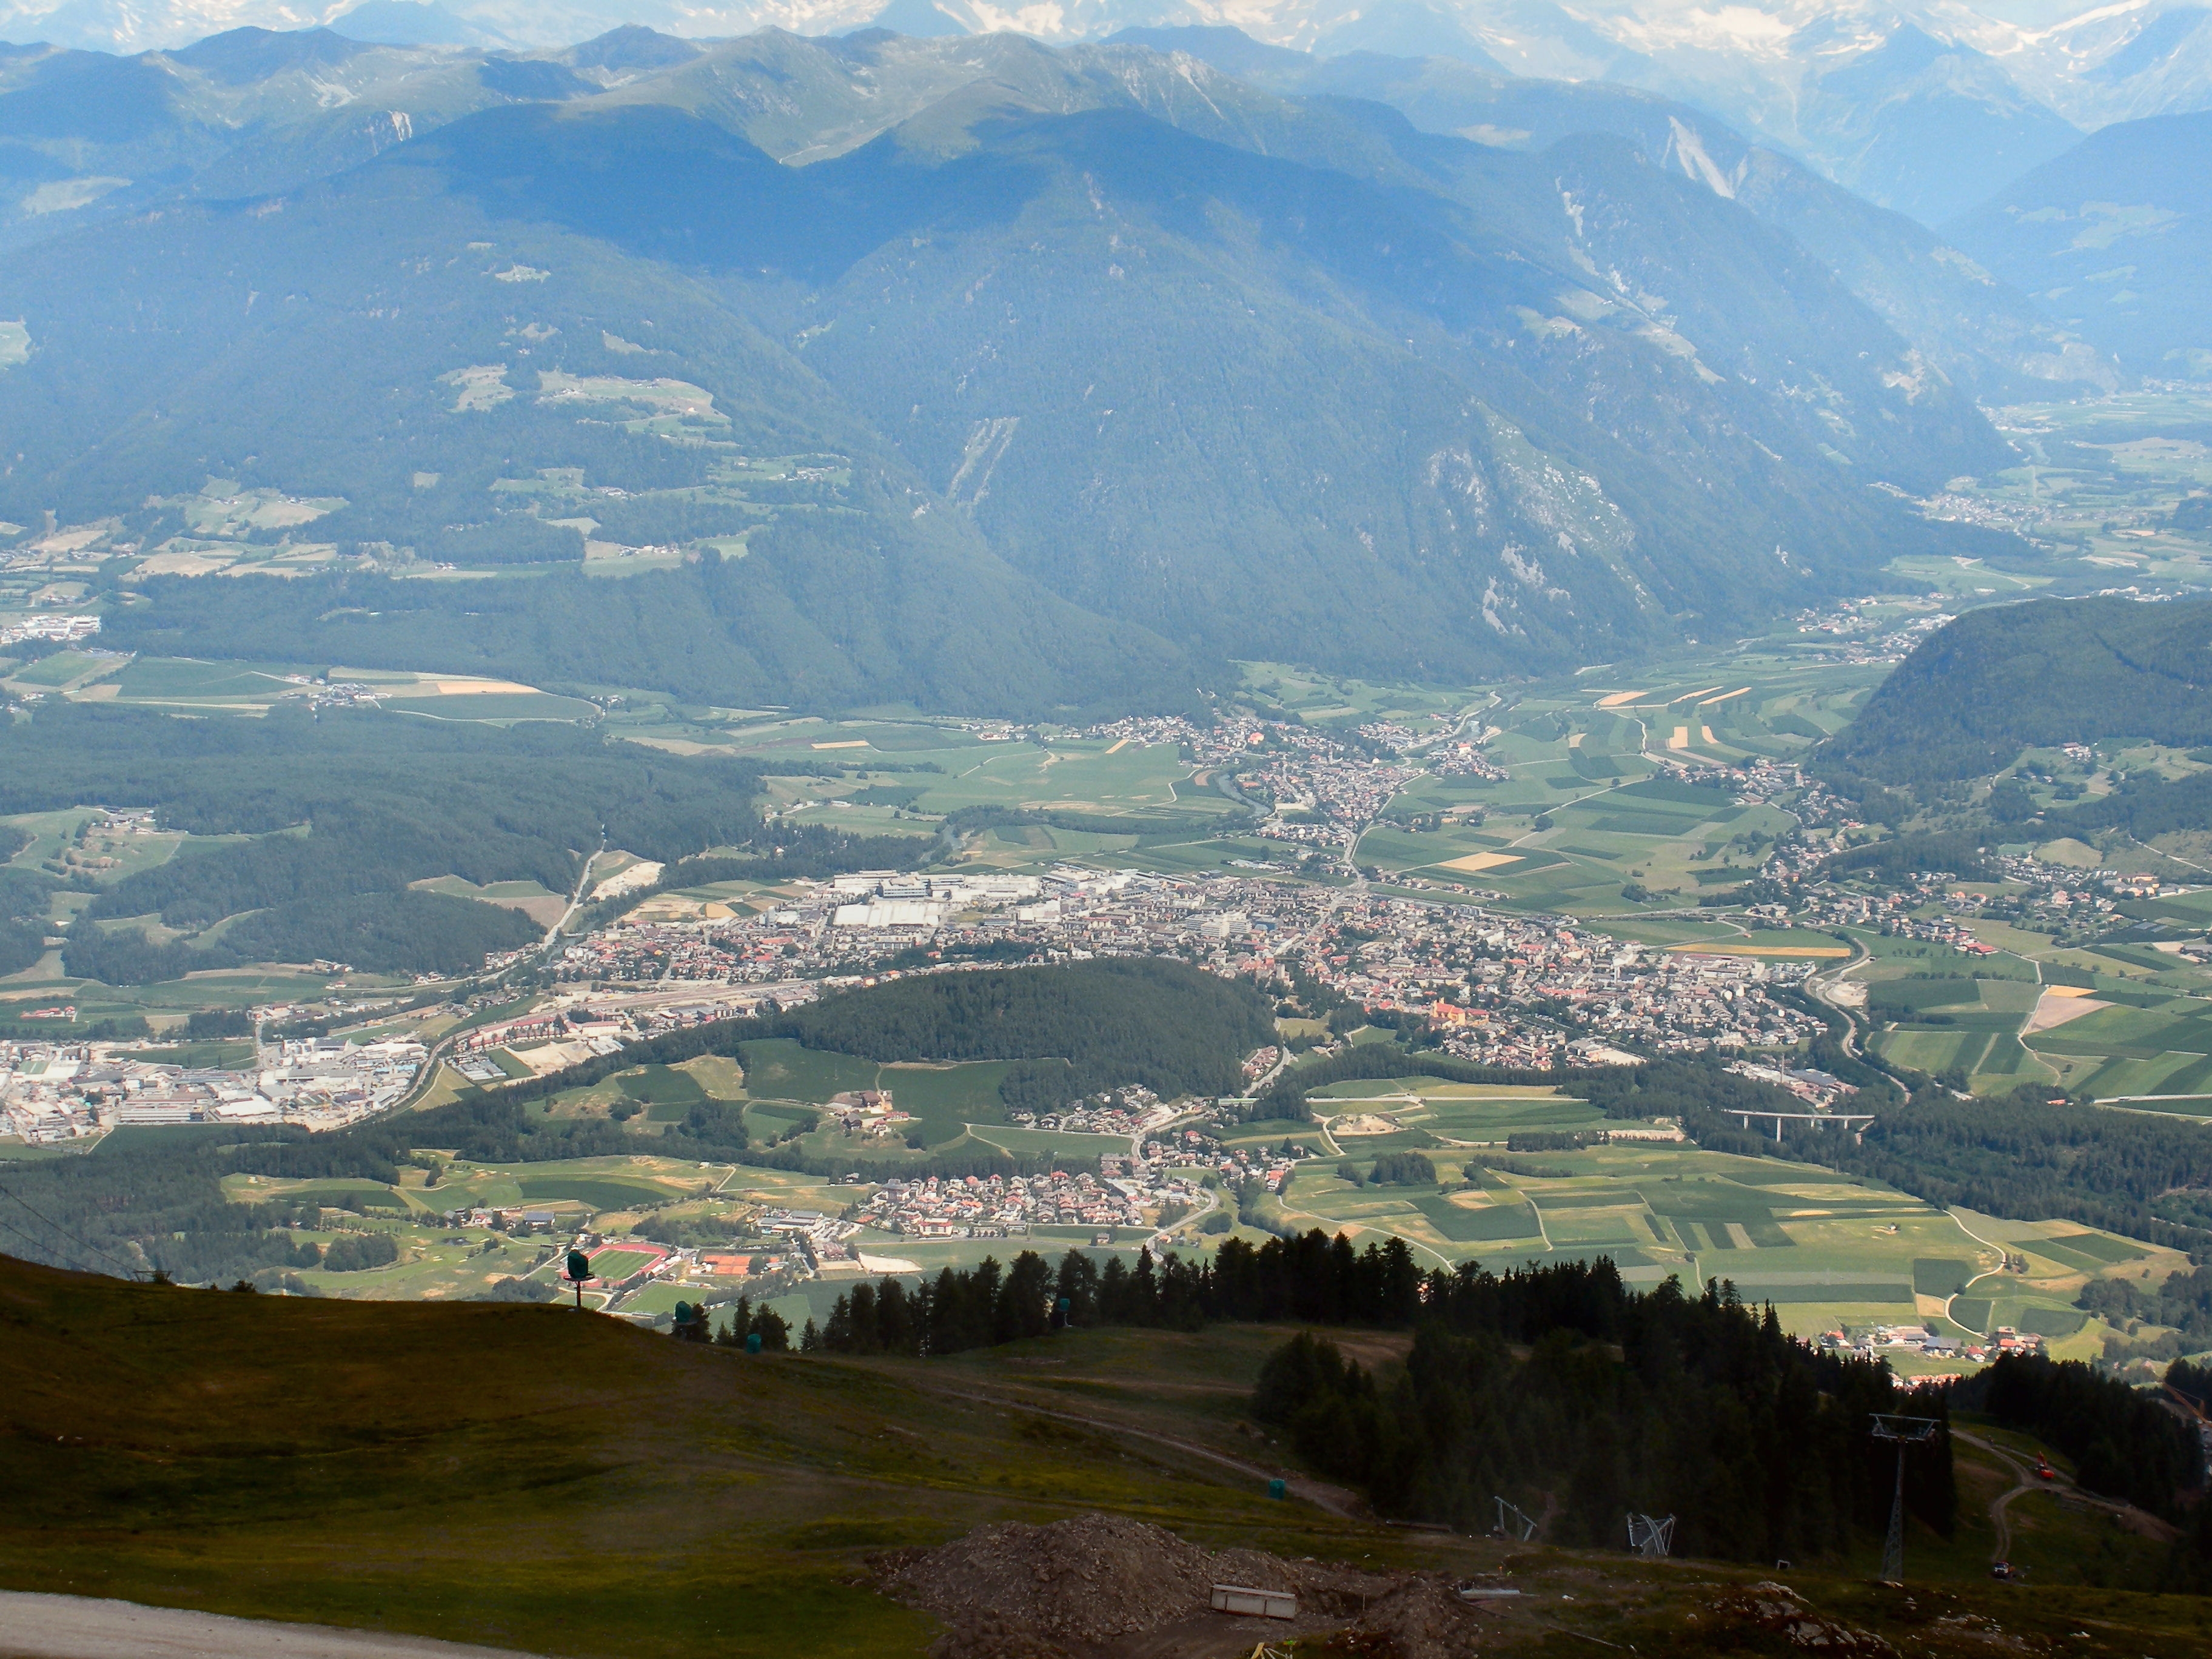
Innichen
Innichen (Italian: San Candido) is a market town and comune (municipality) in South Tyrol in northern Italy. is located in the Puster Valley on the Drava River, about 80 kilometres (50 mi) northeast of Bolzano, on Italy's border with Austria. It hos..
Innichen Wikipedia Page


About Our Data
The data on this page is estimated using a number of publicly available tools and resources. It is provided without warranty, and could contain inaccuracies. Use at your own risk.