Categories in Lipari
Industries
Business Distribution by Industry in Lipari
| Industry Description | Number of Establishments | Average Google Rating |
|---|---|---|
| Other accommodation | 140 | 4.4 |
| Shopping | 90 | 4.2 |
| Restaurants | 68 | 4.2 |
| Hotels and motels | 64 | 4.3 |
| Travel agencies | 54 | 4.6 |
| Sports and recreation | 46 | 4.3 |
| Bed and breakfasts | 37 | 4.5 |
| All food and beverage | 32 | 4.3 |
| Bars, pubs and taverns | 31 | 4.2 |
| Cafes | 24 | 4.3 |
| Italian restaurants | 20 | 4.4 |
| Holiday homes, cabins and resorts | 20 | 4.7 |
| Passenger boats | 18 | 4.5 |
| Clothing stores | 17 | 4.9 |
| Grocery stores and supermarkets | 16 | 4.5 |
| Technical construction services | 16 | 4.7 |
| Bakeries | 16 | 4.4 |
| Pizza | 16 | 4.2 |
| Real estate | 13 | 4 |
| Seafood restaurants | 11 | 4.2 |
| Tour operators | 11 | 4.8 |
| Churches | 11 | 4.2 |
| Rental equipment | 11 | 4.1 |
| Loan companies | 10 | 3.7 |
| Lawyers legal | 9 | 5 |
Lipari Facts
| Area | 5.3 km² |
| Population | 5,630 |
| Male Population | 2,848 (50.6%) |
| Female Population | 2,782 (49.4%) |
| Population change (1975 to 2020) | +38.1% |
| Population change (2000 to 2020) | +12.5% |
| Median Age | 40.8 years (Male: 40.3, Female: 41.2) |
| Neighborhoods | Centro Storico di Lipari, Contrada Santa Lucia |
| Local Time | |
| Timezone | Central European Summer Time |
| Lat & Lng | 38.46743, 14.95398 |
| Postal Codes | 98055 |
Map of Lipari
Interactive Map
Lipari Population
Years 1975 to 2020
| Data | 1975 | 1990 | 2000 | 2015 | 2020 |
|---|---|---|---|---|---|
| Population | 4,077 | 4,685 | 5,005 | 5,685 | 5,630 |
| Population Density | 767.4 / km² | 881.9 / km² | 942.1 / km² | 1,070.1 / km² | 1,059.8 / km² |
Lipari Population change from 2000 to 2015
Increase of 13.6% from year 2000 to 2015
| Location | Change since 1975 | Change since 1990 | Change since 2000 |
|---|---|---|---|
| Lipari | +39.4% | +21.3% | +13.6% |
| Italy | +8.3% | +4.9% | +4.7% |
Lipari Median Age
Median Age: 40.8 years
| Location | Median Age | Median Age (Female) | Median Age (Male) |
|---|---|---|---|
| Lipari | 40.8 yrs | 41.2 yrs | 40.3 yrs |
| Italy | 40.9 yrs | 41.5 yrs | 40.3 yrs |
Lipari Population Density
Population Density: 1,060 / km²
| Location | Population | Area | Density |
|---|---|---|---|
| Lipari | 5,630 | 5.3 km² | 1,060 / km² |
| Italy | 59.3 million | 301,510.7 km² | 197 / km² |
Lipari Historical and Projected Population
Estimated Population from 1975 to 2100
- JRC (European Commission's Joint Research Centre) work on the GHS built-up grid
- CIESIN (Center for International Earth Science Information Network)
- [Link] Klein Goldewijk, K., Beusen, A., Doelman, J., and Stehfest, E.: Anthropogenic land use estimates for the Holocene – HYDE 3.2, Earth Syst. Sci. Data, 9, 927–953, https://doi.org/10.5194/essd-9-927-2017, 2017.
Area Codes
Percentage Area Codes used by businesses in Lipari
Postal Codes
Percentage of businesses by Postal Codes in Lipari
Price Distribution
Business distribution by price for Lipari
Human Development Index (HDI)
Statistic composite index of life expectancy, education, and per capita income.
Lipari CO2 Emissions
Carbon Dioxide (CO2) Emissions Per Capita in Tonnes Per Year
| Location | CO2 Emissions | CO2 Emissions Per Capita | CO2 Emissions Intensity |
|---|---|---|---|
| Lipari | 43,147 tn | 7.66 tn | 8,121.9 tons/km² |
| Italy | 399,008,505 tn | 6.73 tn | 1,323.4 tons/km² |
| 2013 CO2 emissions (tonnes/year) | 43,147 tn |
| 2013 CO2 emissions (tonnes/year) per capita | 7.66 tn |
| 2013 CO2 emissions intensity (tonnes/km²/year) | 8,121.9 tons/km² |
Natural Hazards Risk
Relative risk out of 10
| Hazard | Risk Level |
|---|---|
| Drought | High (8) |
| Earthquake | Medium (5.7) |
| Landslide | Medium (6) |
| Volcano | Medium (5) |
* Risk, particularly concerning flood or landslide, may not be for the entire area.
- Dilley, M., R.S. Chen, U. Deichmann, A.L. Lerner-Lam, M. Arnold, J. Agwe, P. Buys, O. Kjekstad, B. Lyon, and G. Yetman. 2005. Natural Disaster Hotspots: A Global Risk Analysis. Washington, D.C.: World Bank. https://doi.org/10.1596/0-8213-5930-4.
- Center for Hazards and Risk Research - CHRR - Columbia University, Center for International Earth Science Information Network - CIESIN - Columbia University, and Norwegian Geotechnical Institute - NGI. 2005. Global Landslide Hazard Distribution. Palisades, NY: NASA Socioeconomic Data and Applications Center (SEDAC). https://doi.org/10.7927/H4P848VZ.
- Center for Hazards and Risk Research - CHRR - Columbia University, Center for International Earth Science Information Network - CIESIN - Columbia University, and International Research Institute for Climate and Society - IRI - Columbia University. 2005. Global Drought Hazard Frequency and Distribution. Palisades, NY: NASA Socioeconomic Data and Applications Center (SEDAC). https://doi.org/10.7927/H4VX0DFT.
- Center for Hazards and Risk Research - CHRR - Columbia University, Center for International Earth Science Information Network - CIESIN - Columbia University. 2005. Global Volcano Hazard Frequency and Distribution. Palisades, NY: NASA Socioeconomic Data and Applications Center (SEDAC). https://doi.org/10.7927/H4BR8Q45.
- Center for Hazards and Risk Research - CHRR - Columbia University, Center for International Earth Science Information Network - CIESIN - Columbia University. 2005. Global Earthquake Hazard Distribution - Peak Ground Acceleration. Palisades, NY: NASA Socioeconomic Data and Applications Center (SEDAC). https://doi.org/10.7927/H4BZ63ZS.
Recent Nearby Earthquakes
Magnitude 3.0 and greater
| Date▼ | Time↕ | Magnitude↕ | Distance↕ | Depth↕ | Location↕ | Link |
|---|---|---|---|---|---|---|
| 8/17/19 | 9:35 PM | 4.1 | 44.2 km | 284,070 m | 44km NNW of Lipari, Italy | usgs.gov |
| 1/25/19 | 3:52 PM | 4.5 | 33.4 km | 216,460 m | 33km NE of Lipari, Italy | usgs.gov |
| 2/27/17 | 6:20 AM | 4.3 | 5.3 km | 10,000 m | 5km NNE of Lipari, Italy | usgs.gov |
| 10/14/15 | 10:20 AM | 4.5 | 35.9 km | 309,000 m | 35km NNW of Lipari, Italy | usgs.gov |
| 5/9/15 | 8:22 AM | 4.7 | 38.3 km | 215,000 m | 38km ENE of Lipari, Italy | usgs.gov |
| 2/6/15 | 8:52 AM | 4.8 | 33.7 km | 245,410 m | 33km NNE of Lipari, Italy | usgs.gov |
| 2/13/14 | 11:30 AM | 4.2 | 34.1 km | 148,360 m | 21km NNW of Villafranca Tirrena, Italy | usgs.gov |
| 1/14/14 | 4:35 AM | 4 | 11.8 km | 11,000 m | 11km S of Lipari, Italy | usgs.gov |
| 1/14/14 | 3:43 AM | 4 | 10.6 km | 12,000 m | 10km SSW of Lipari, Italy | usgs.gov |
| 8/15/13 | 11:06 PM | 4.4 | 33.1 km | 10,400 m | 2km E of Gioiosa Marea, Italy | usgs.gov |
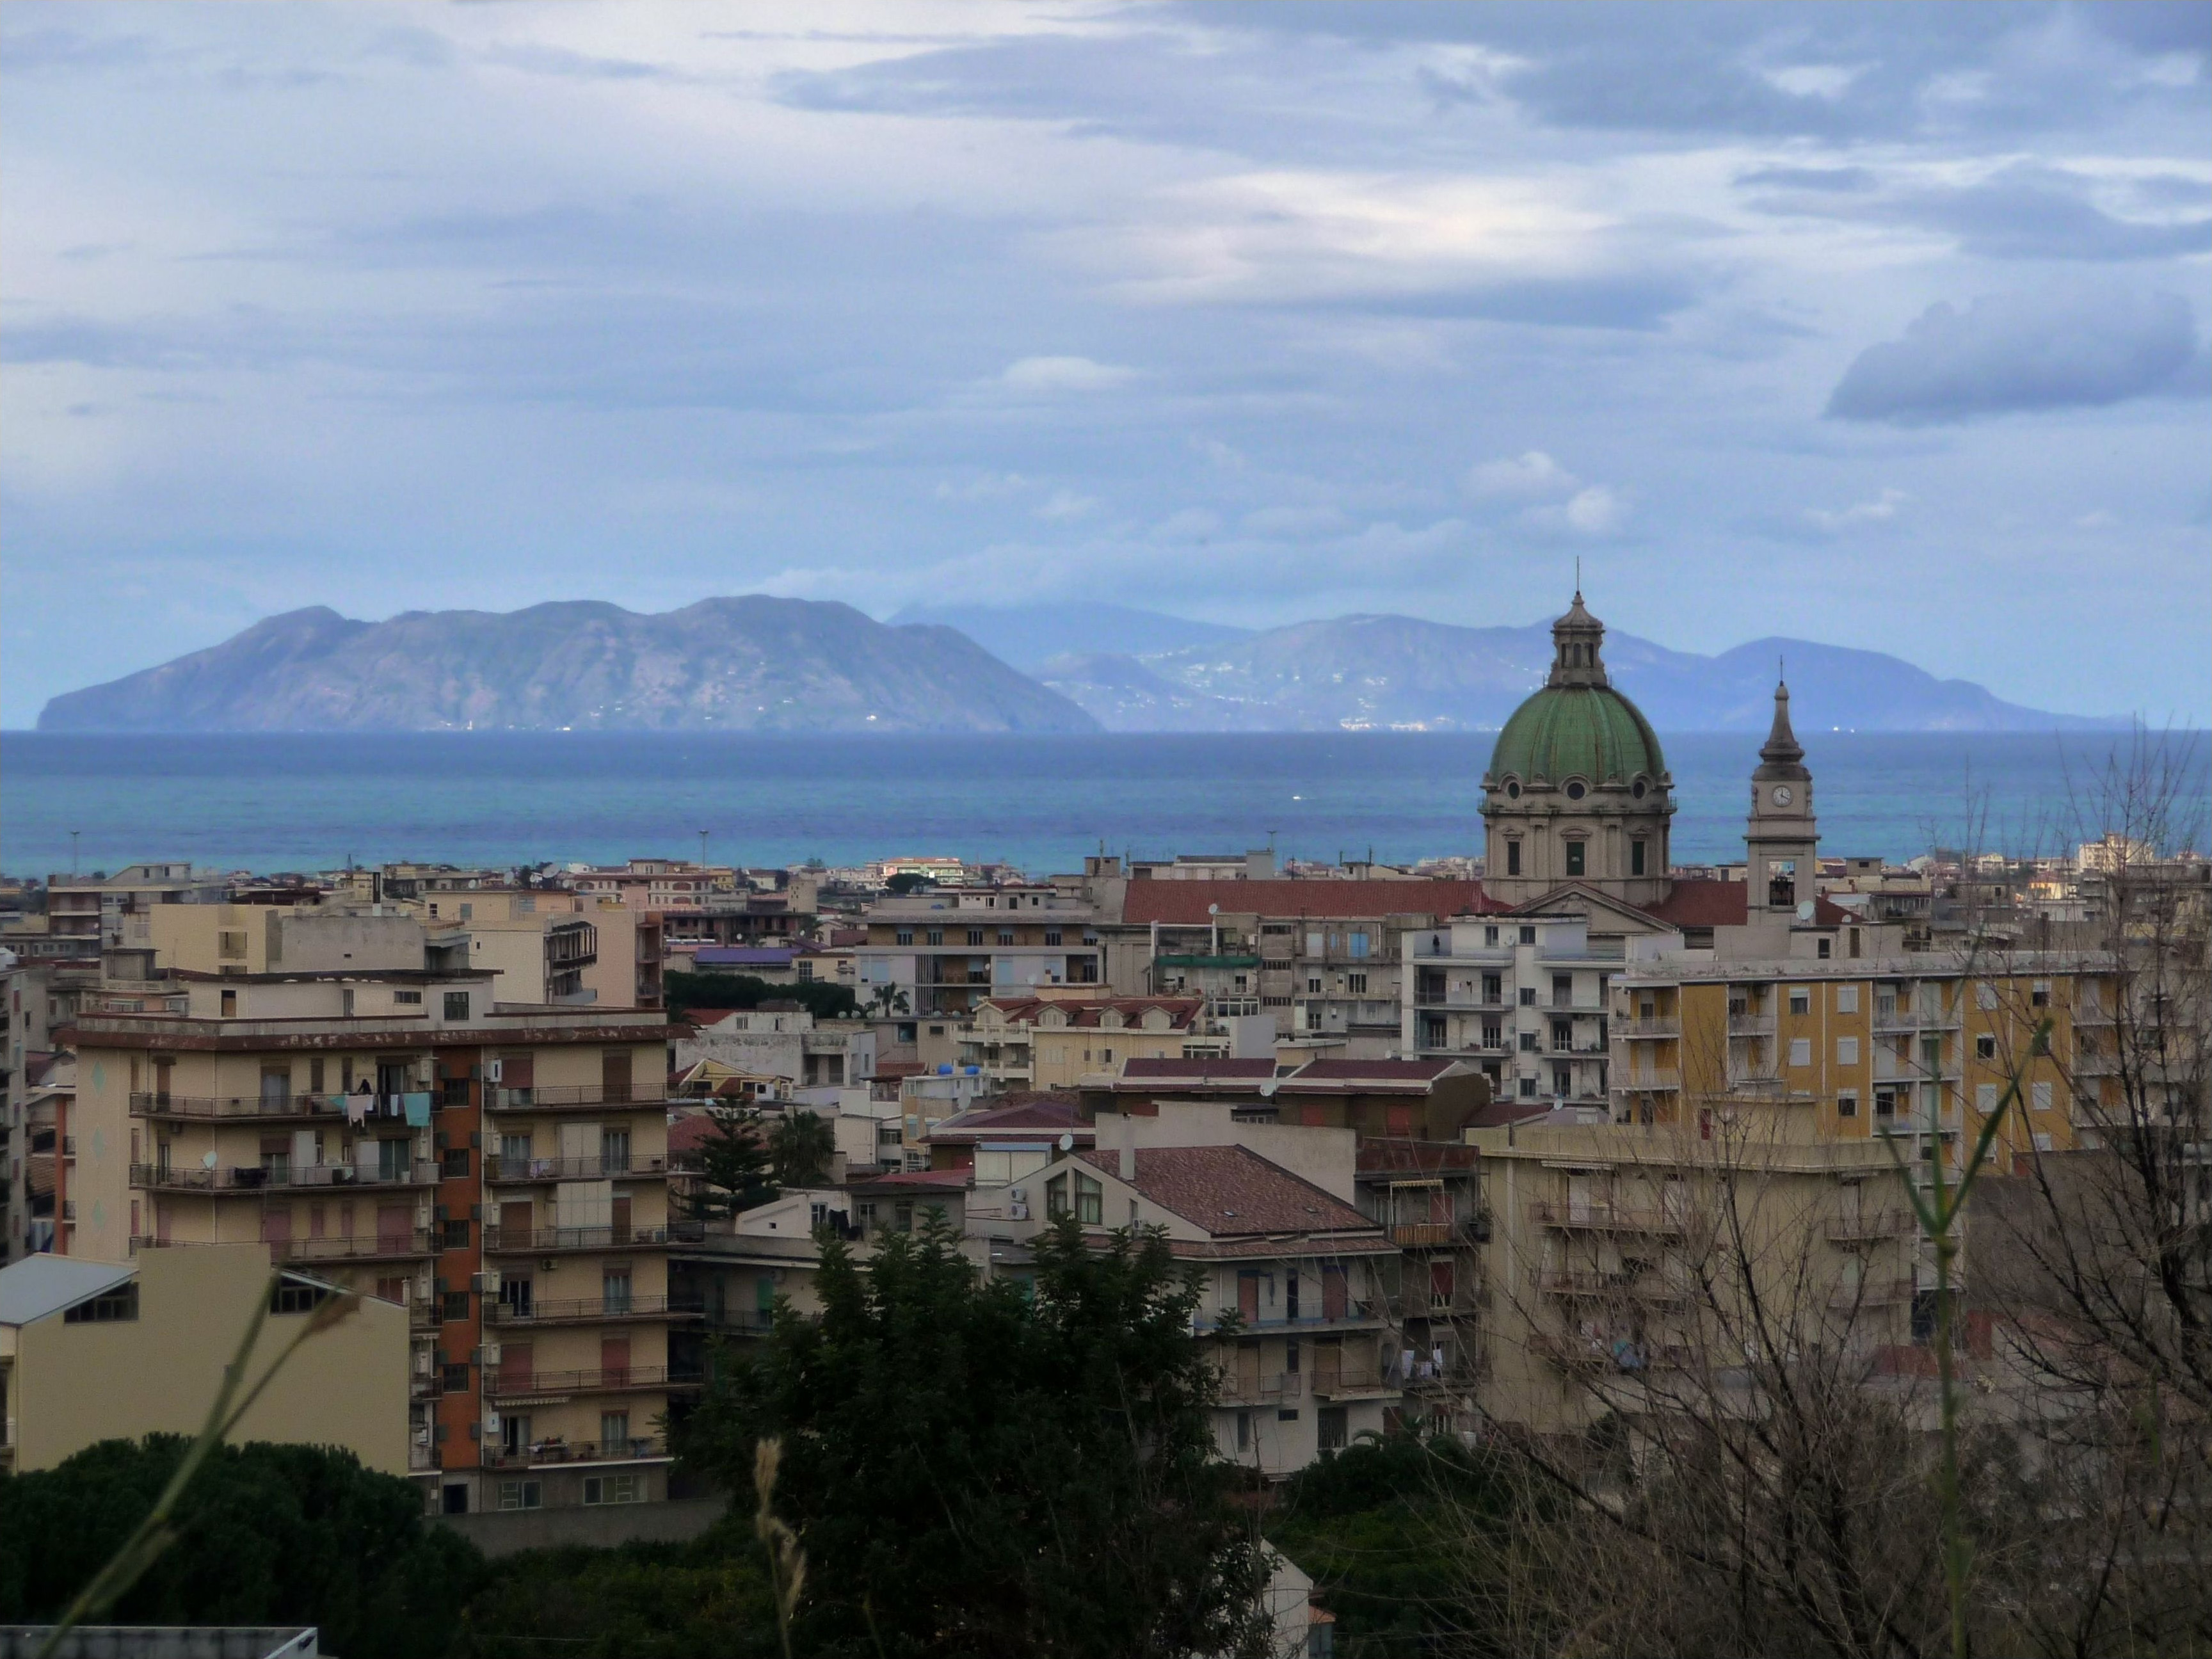
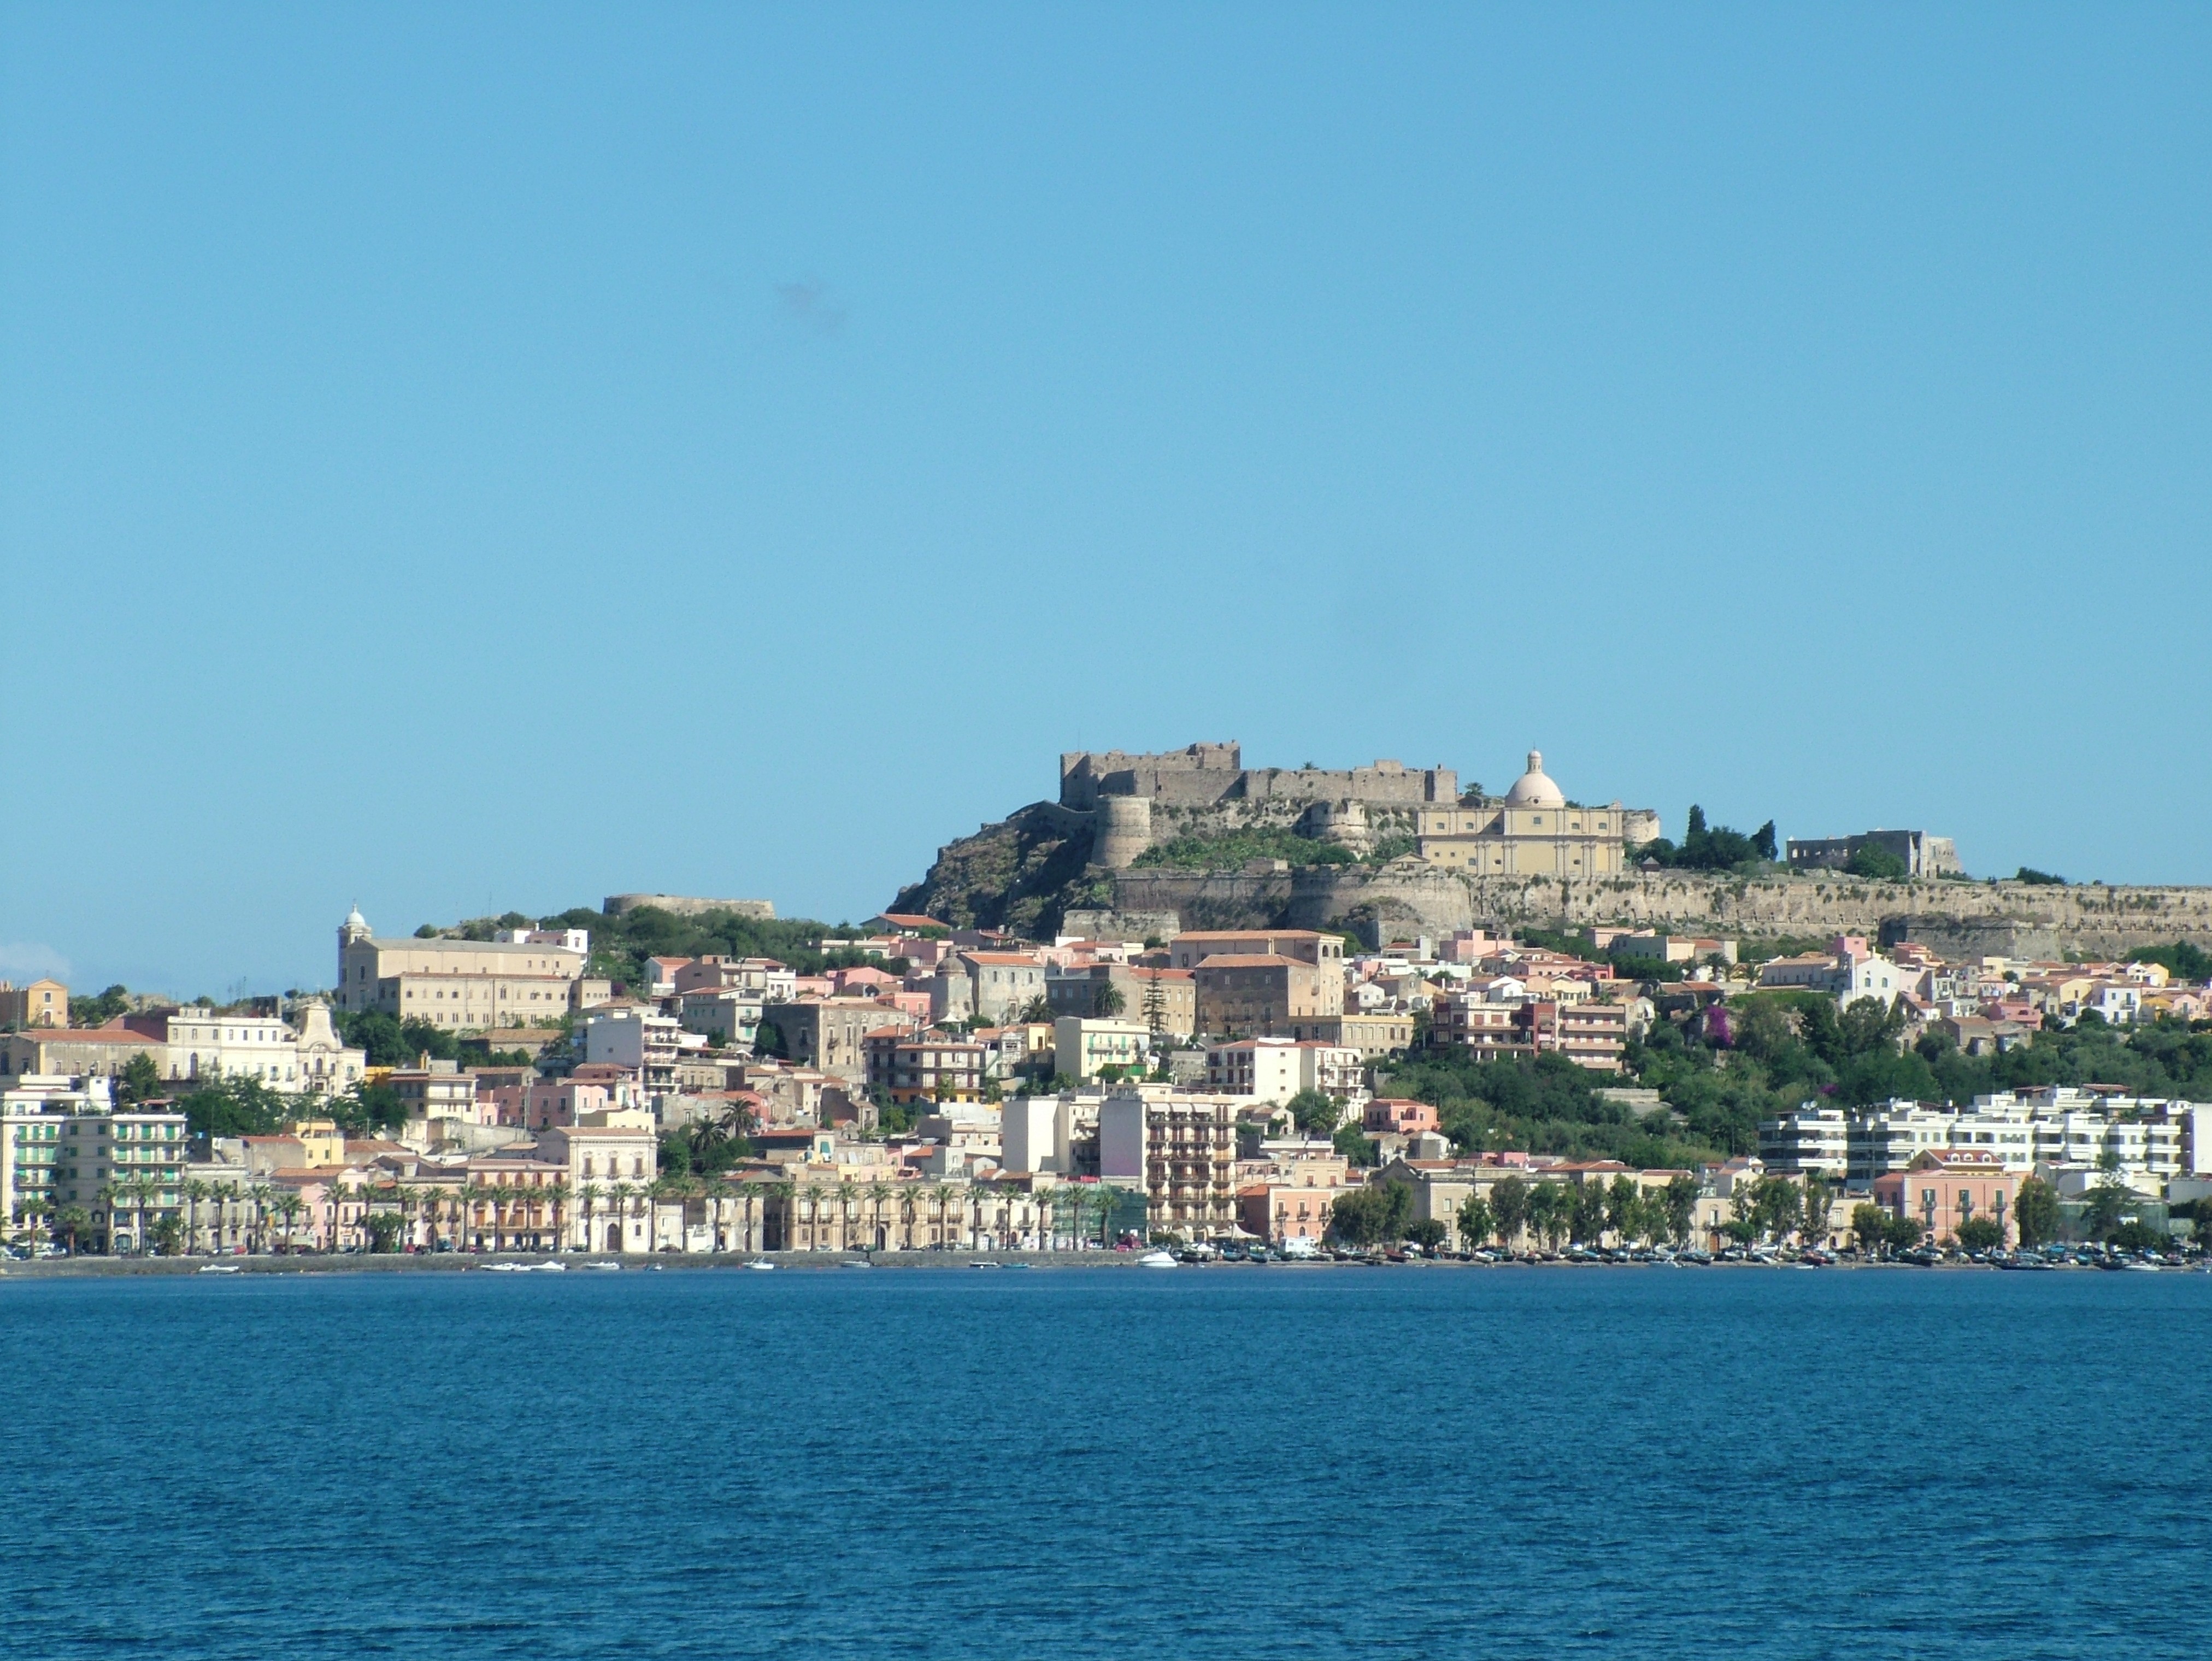
Lipari
Lipari (Sicilian: Lìpari, Latin: Lipara, Ancient Greek: Μελιγουνίς (Meligunís) or Λιπάρα (Lipára)) is the largest of the Aeolian Islands in the Tyrrhenian Sea off the northern coast of Sicily, and the name of the island's main town. Its population is..
Lipari Wikipedia Page

About Our Data
The data on this page is estimated using a number of publicly available tools and resources. It is provided without warranty, and could contain inaccuracies. Use at your own risk.