Categories in Murlo
Industries
Business Distribution by Industry in Murlo
| Industry Description | Number of Establishments |
|---|---|
| Other accommodation | 37 |
| Buses and trains | 19 |
| Restaurants | 12 |
| Tractors and farm equipment | 11 |
| Grocery stores and supermarkets | 11 |
| Hotels and motels | 11 |
| All food and beverage | 11 |
| Museums | 10 |
| Churches | 10 |
| Travel agencies | 9 |
| Gas station | 8 |
| Banks | 6 |
| Corporate management | 6 |
| Bars, pubs and taverns | 5 |
| Shopping | 5 |
| Public parks | 5 |
Murlo Facts
| Area | 0.4 km² |
| Population | 870 |
| Male Population | 440 (50.6%) |
| Female Population | 430 (49.4%) |
| Population change (1975 to 2020) | +135.8% |
| Population change (2000 to 2020) | +80.9% |
| Median Age | 41.8 years (Male: 41.3, Female: 42.3) |
| Neighborhoods | Palazzina |
| Local Time | |
| Timezone | Central European Summer Time |
| Lat & Lng | 43.16114, 11.38794 |
| Postal Codes | 53016 |
Map of Murlo
Interactive Map
Murlo Population
Years 1975 to 2030
| Data | 1975 | 1990 | 2000 | 2015 | 2020 | 2025* | 2030* |
|---|---|---|---|---|---|---|---|
| Population | 369 | 465 | 481 | 602 | 870 | 839 | 804 |
| Population Density | 984 / km² | 1,240 / km² | 1,282.7 / km² | 1,605.3 / km² | 2,320 / km² | 2,237.3 / km² | 2,144 / km² |
Murlo Population change from 2000 to 2020
Increase of 80.9% from year 2000 to 2020
| Location | Change since 1975 | Change since 1990 | Change since 2000 |
|---|---|---|---|
| Murlo | +135.8% | +87.1% | +80.9% |
| Italy | — | — | — |
Murlo Median Age
Median Age: 41.8 years
| Location | Median Age | Median Age (Female) | Median Age (Male) |
|---|---|---|---|
| Murlo | 41.8 yrs | 42.3 yrs | 41.3 yrs |
| Italy | 40.9 yrs | 41.5 yrs | 40.3 yrs |
Murlo Population Density
Population Density: 2,320 / km²
| Location | Population | Area | Density |
|---|---|---|---|
| Murlo | 870 | 0.375 km² | 2,320 / km² |
| Italy | 59.3 million | 301,510.7 km² | 197 / km² |
Murlo Historical and Projected Population
Estimated Population from 0 to 2100
- JRC (European Commission's Joint Research Centre) work on the GHS built-up grid
- CIESIN (Center for International Earth Science Information Network)
- [Link] Klein Goldewijk, K., Beusen, A., Doelman, J., and Stehfest, E.: Anthropogenic land use estimates for the Holocene – HYDE 3.2, Earth Syst. Sci. Data, 9, 927–953, https://doi.org/10.5194/essd-9-927-2017, 2017.
Price Distribution
Business distribution by price for Murlo
Human Development Index (HDI)
Statistic composite index of life expectancy, education, and per capita income.
Murlo CO2 Emissions
Carbon Dioxide (CO2) Emissions Per Capita in Tonnes Per Year
| Location | CO2 Emissions | CO2 Emissions Per Capita | CO2 Emissions Intensity |
|---|---|---|---|
| Murlo | 6,421 tn | 7.38 tn | 17,122.5 tons/km² |
| Italy | 399,008,505 tn | 6.73 tn | 1,323.4 tons/km² |
| 2013 CO2 emissions (tonnes/year) | 6,421 tn |
| 2013 CO2 emissions (tonnes/year) per capita | 7.38 tn |
| 2013 CO2 emissions intensity (tonnes/km²/year) | 17,122.5 tons/km² |
Natural Hazards Risk
Relative risk out of 10
| Hazard | Risk Level |
|---|---|
| Earthquake | Medium (6) |
* Risk, particularly concerning flood or landslide, may not be for the entire area.
- Dilley, M., R.S. Chen, U. Deichmann, A.L. Lerner-Lam, M. Arnold, J. Agwe, P. Buys, O. Kjekstad, B. Lyon, and G. Yetman. 2005. Natural Disaster Hotspots: A Global Risk Analysis. Washington, D.C.: World Bank. https://doi.org/10.1596/0-8213-5930-4.
- Center for Hazards and Risk Research - CHRR - Columbia University, Center for International Earth Science Information Network - CIESIN - Columbia University. 2005. Global Earthquake Hazard Distribution - Peak Ground Acceleration. Palisades, NY: NASA Socioeconomic Data and Applications Center (SEDAC). https://doi.org/10.7927/H4BZ63ZS.
Recent Nearby Earthquakes
Magnitude 3.0 and greater
| Date▼ | Time↕ | Magnitude↕ | Distance↕ | Depth↕ | Location↕ | Link |
|---|---|---|---|---|---|---|
| 6/15/19 | 5:31 PM | 3 | 48.6 km | 11,830 m | 4km SSW of Cetona, Italy | usgs.gov |
| 5/1/18 | 5:16 AM | 4.1 | 29.7 km | 10,000 m | 9km NNW of Chiusdino, Italy | usgs.gov |
| 10/25/16 | 4:53 PM | 4.2 | 54.9 km | 10,000 m | 5km NNE of Certaldo, Italy | usgs.gov |
| 5/30/16 | 8:24 PM | 4.4 | 68.5 km | 15,000 m | 1km WNW of Castel Giorgio, Italy | usgs.gov |
| 9/13/15 | 1:04 AM | 4.2 | 44.9 km | 4,110 m | 4km SW of Greve, Italy | usgs.gov |
| 3/4/15 | 12:00 AM | 4 | 52.1 km | 9,200 m | 4km N of Tavarnelle Val di Pesa, Italy | usgs.gov |
| 3/3/15 | 11:51 PM | 3.3 | 51 km | 10,100 m | 3km N of Tavarnelle Val di Pesa, Italy | usgs.gov |
| 12/19/14 | 10:36 AM | 3.9 | 50.5 km | 7,100 m | 5km WNW of Greve, Italy | usgs.gov |
| 12/19/14 | 9:39 AM | 3.8 | 50.4 km | 9,300 m | 5km WNW of Greve, Italy | usgs.gov |
| 4/17/13 | 2:50 PM | 3.3 | 60 km | 8,000 m | central Italy | usgs.gov |
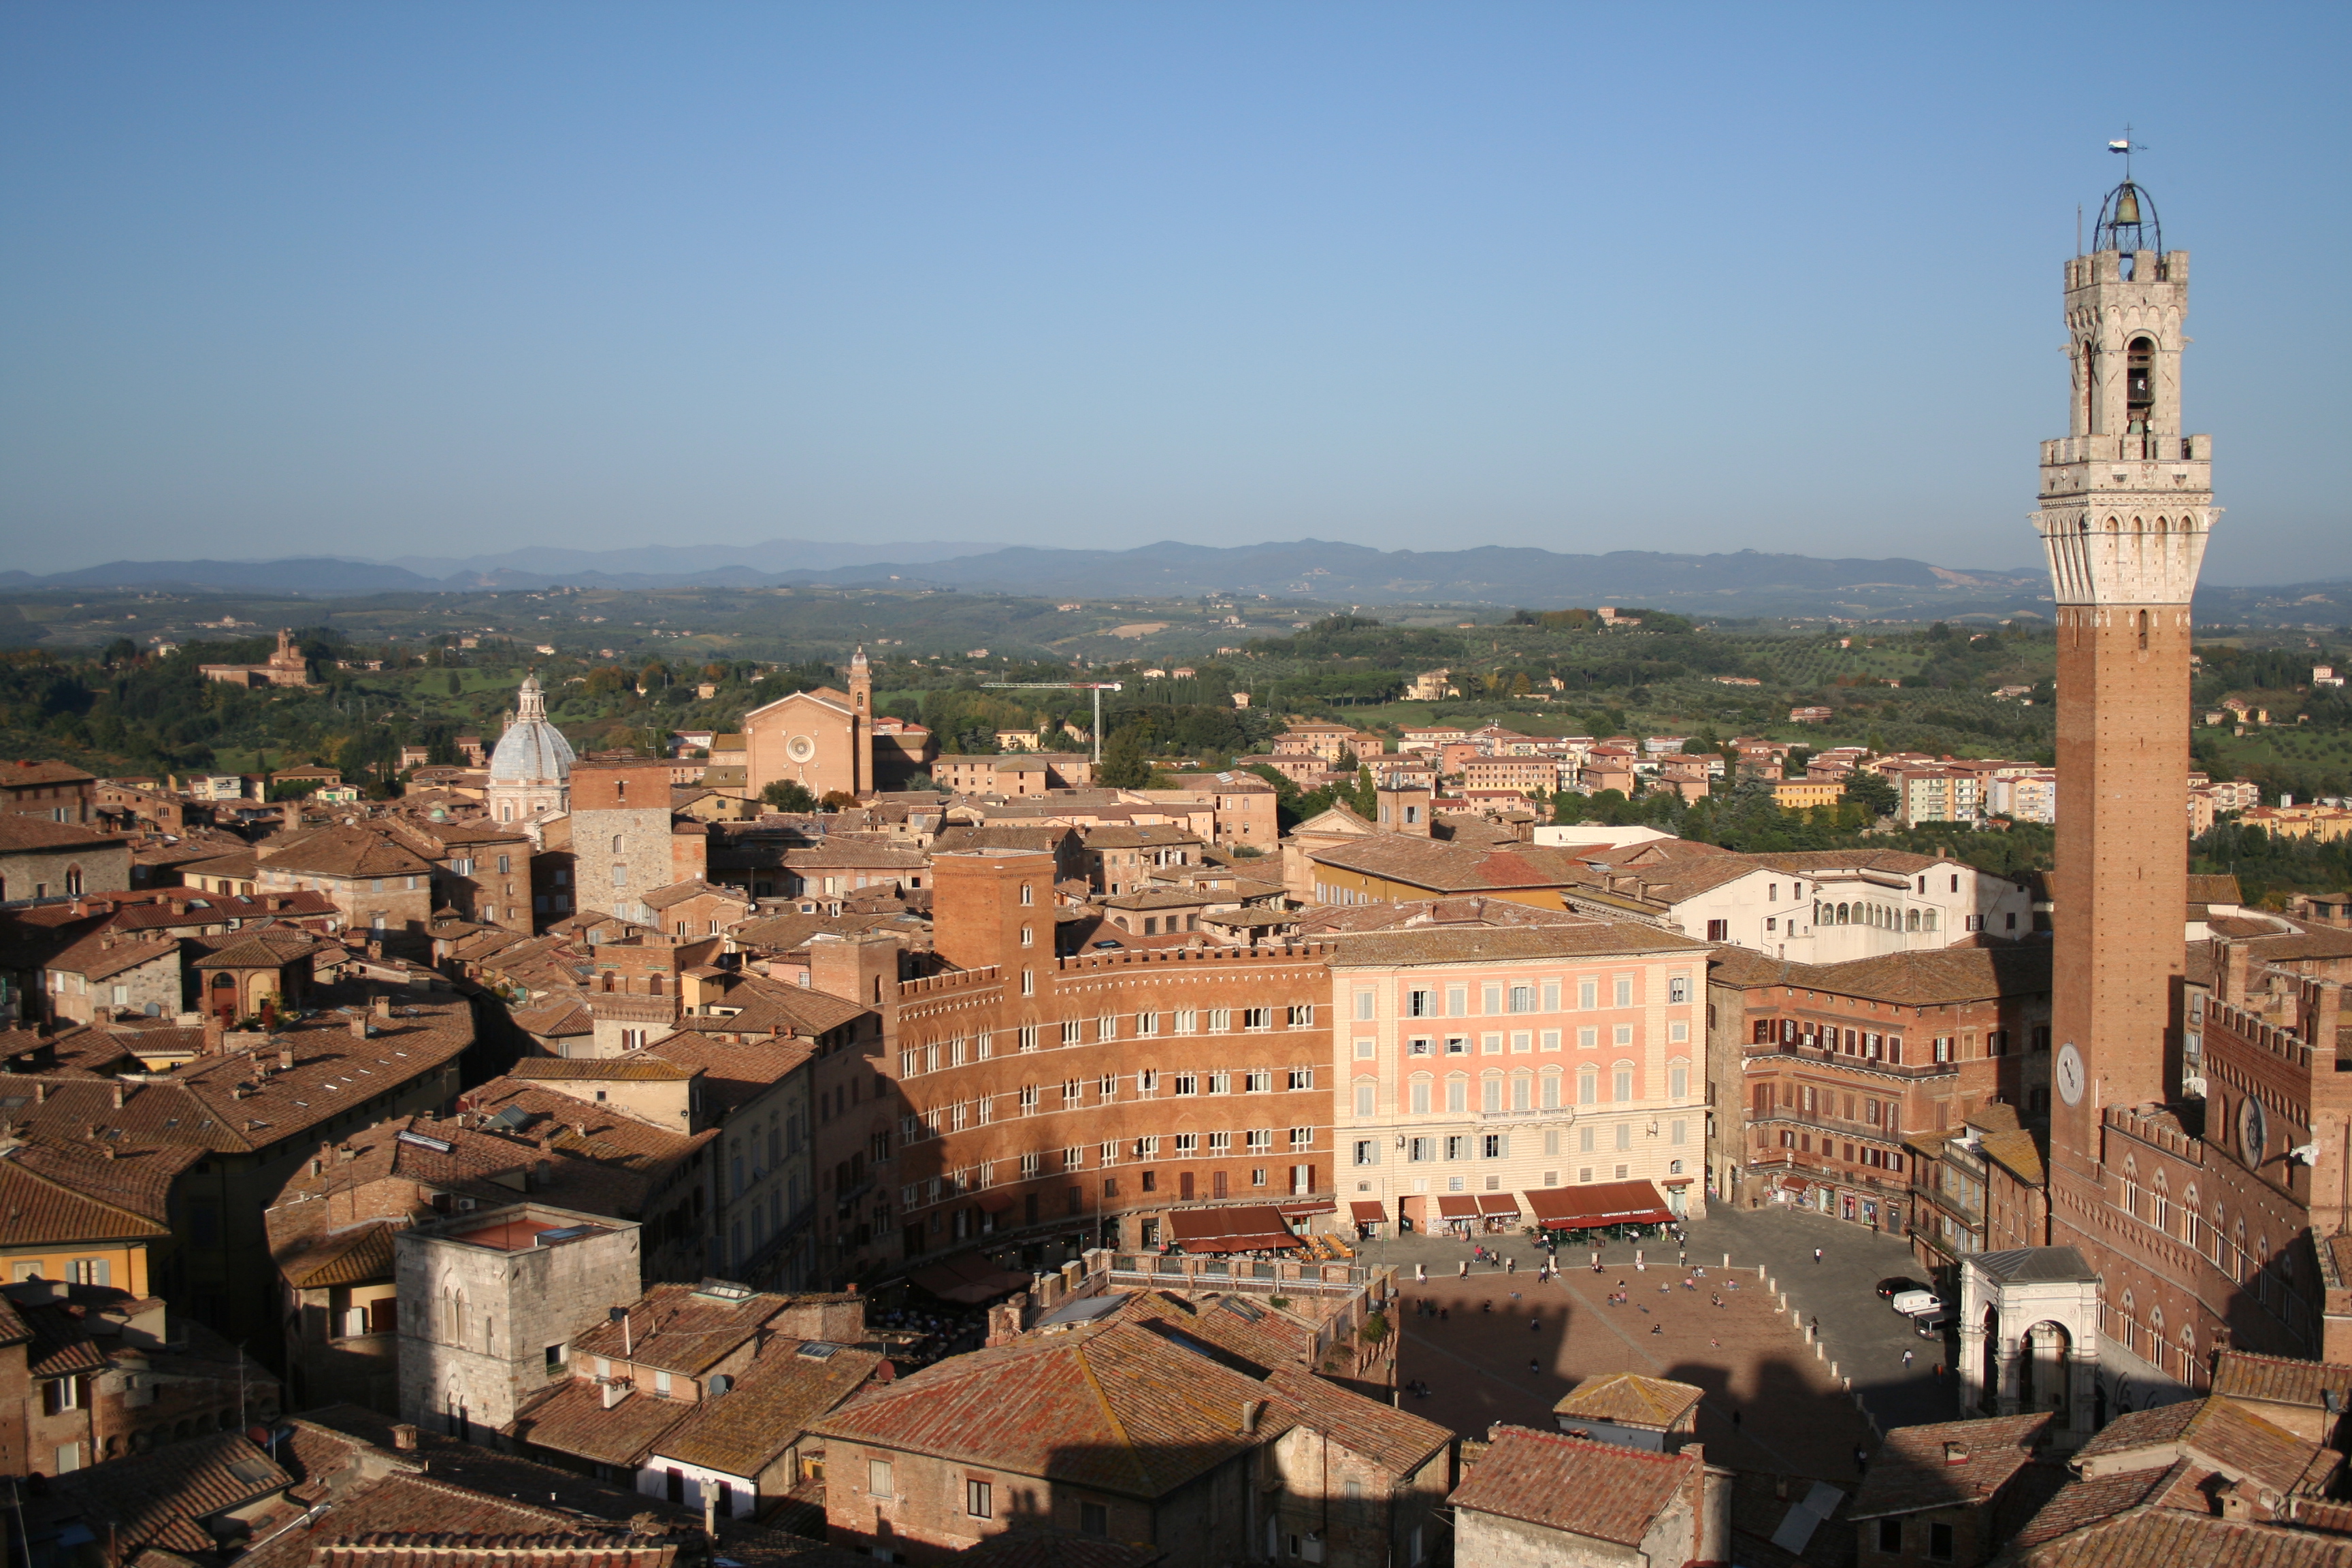
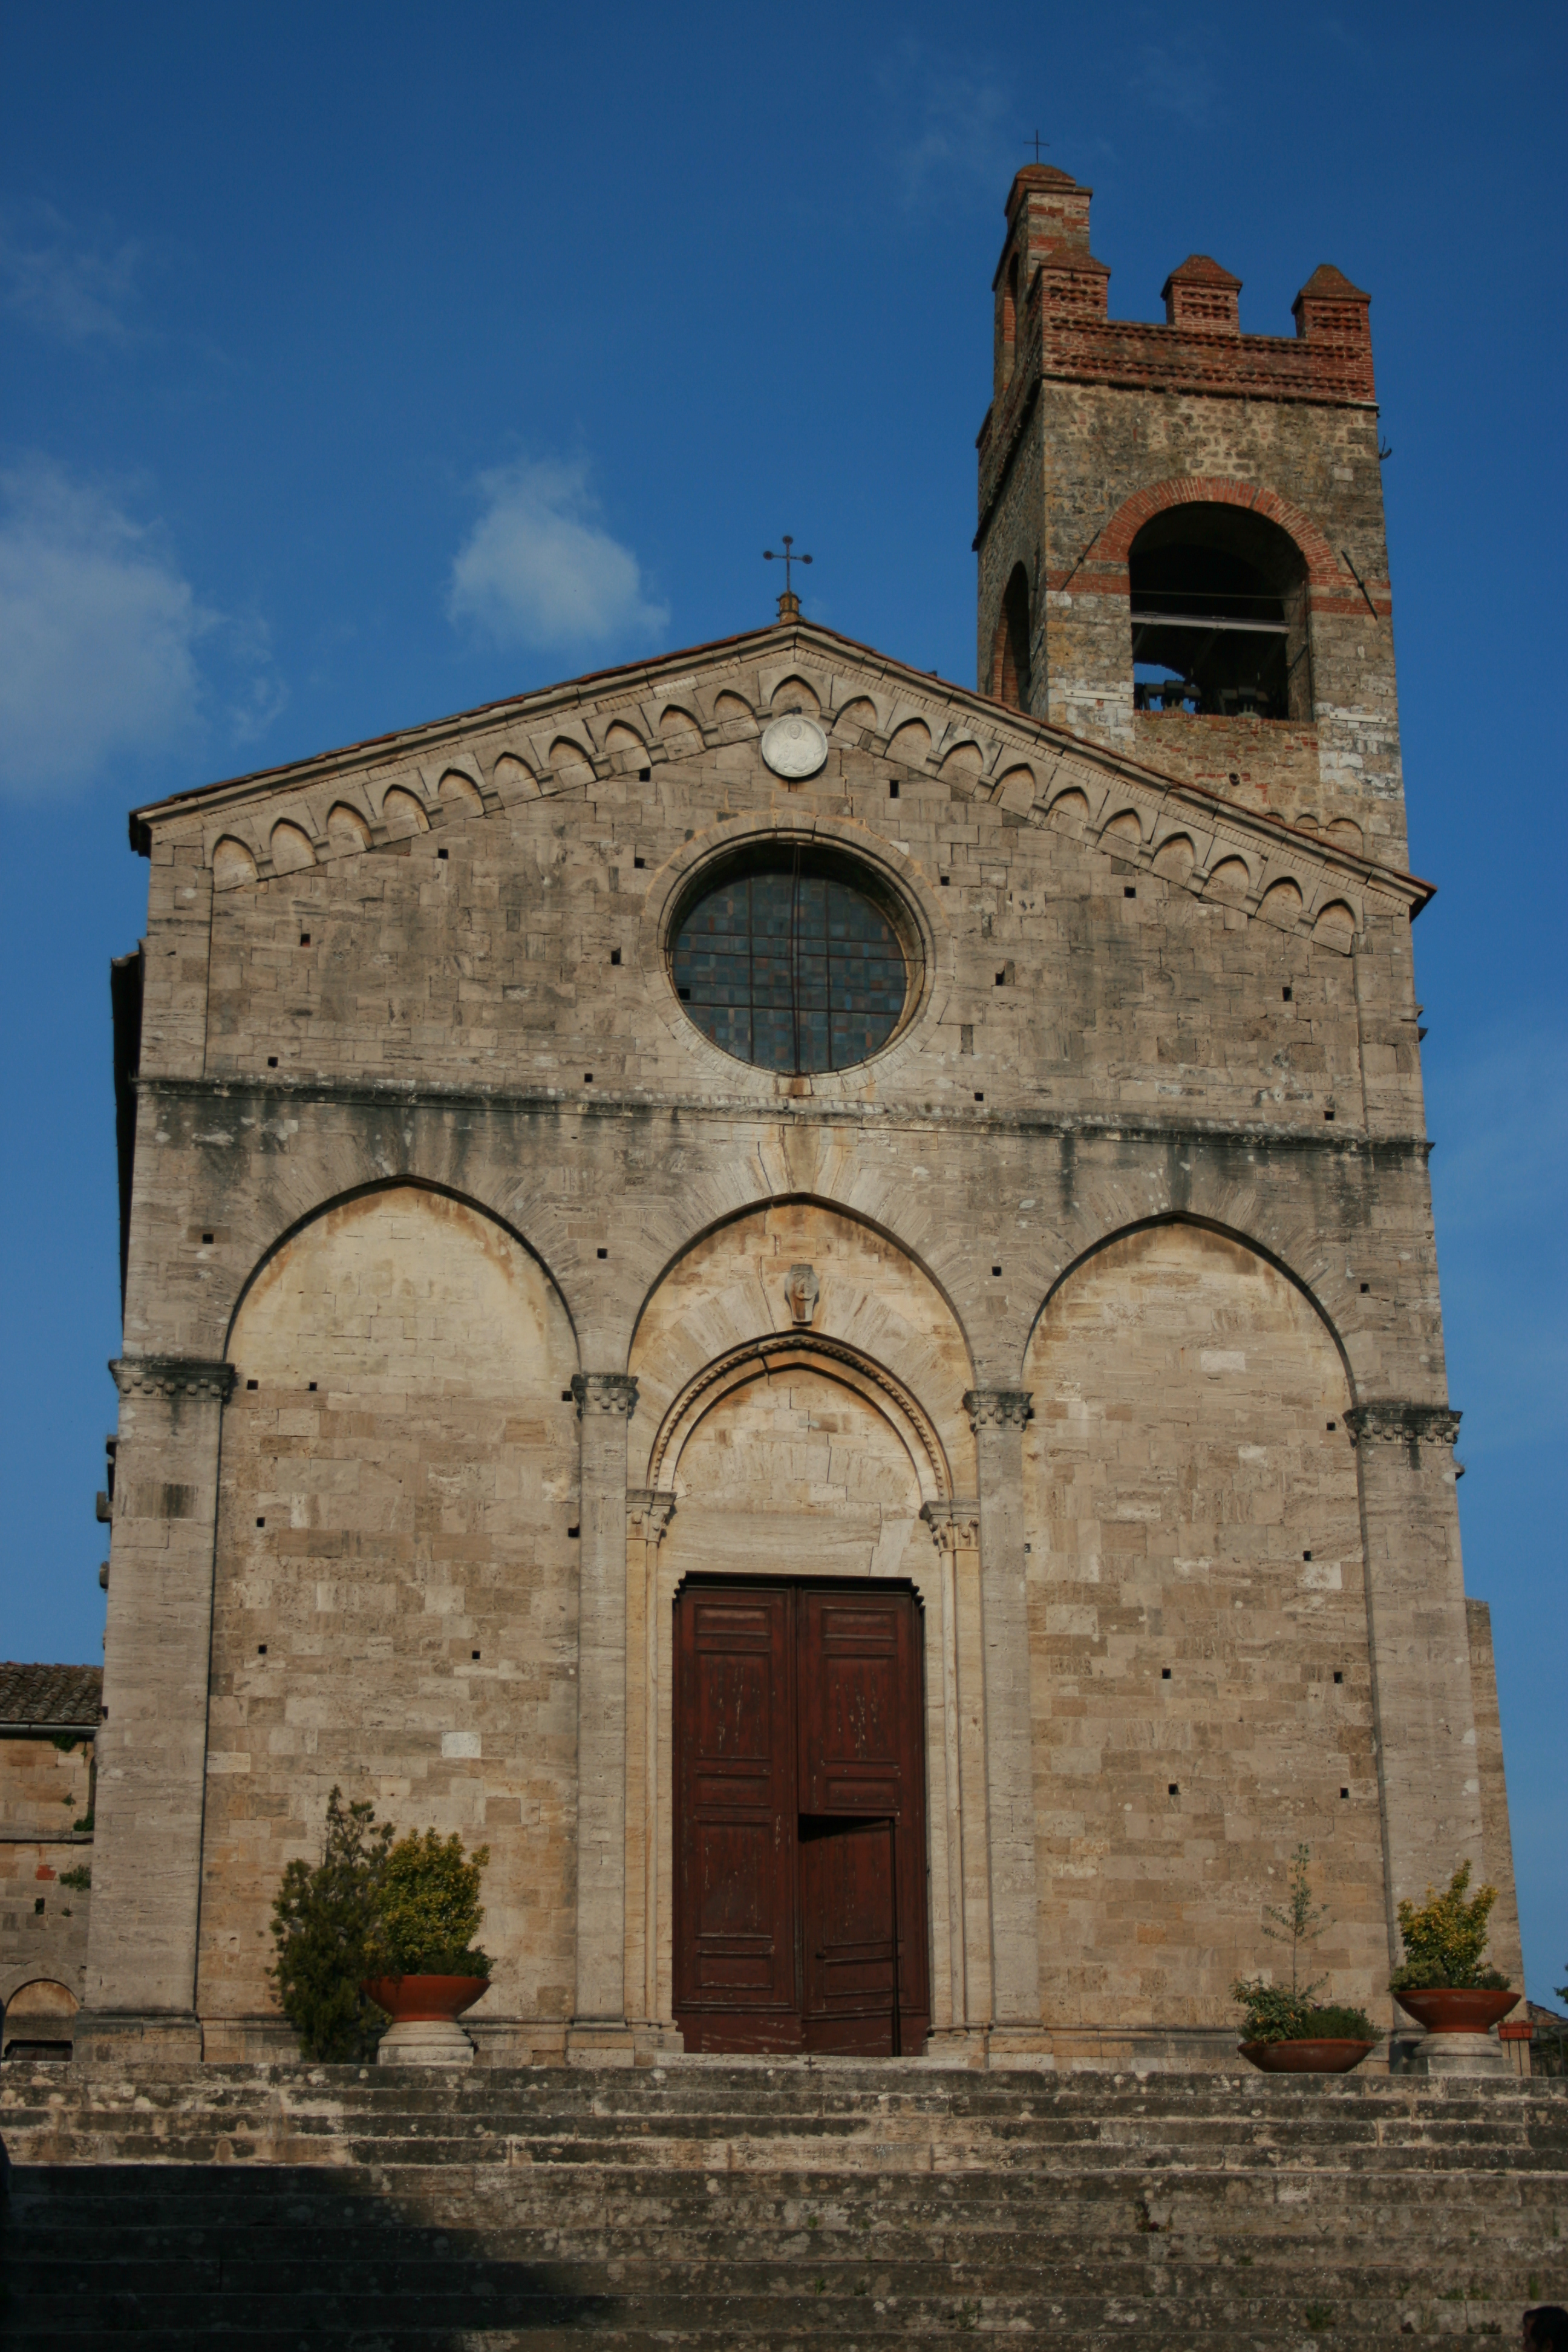
Murlo
Murlo is a comune (municipality) in the Province of Siena in the Italian region Tuscany, located about 70 kilometres (43 mi) south of Florence and about 20 kilometres (12 mi) south of Siena. borders the following municipalities: Buonconvento, Civite..
Murlo Wikipedia Page

About Our Data
The data on this page is estimated using a number of publicly available tools and resources. It is provided without warranty, and could contain inaccuracies. Use at your own risk.