Categories in Narni
Industries
Business Distribution by Industry in Narni
| Industry Description | Number of Establishments | Average Google Rating |
|---|---|---|
| Shopping | 85 | 4.3 |
| Restaurants | 56 | 4.2 |
| Grocery stores and supermarkets | 31 | 4.4 |
| Other accommodation | 28 | 4.2 |
| Bars, pubs and taverns | 25 | 4.2 |
| All food and beverage | 23 | 4.4 |
| General contractors | 20 | 4.2 |
| Italian restaurants | 18 | 4.2 |
| Churches | 17 | 4.5 |
| Construction of buildings | 17 | 4.3 |
| Public administration | 17 | 4.3 |
| Hotels and motels | 16 | 4.1 |
| Tractors and farm equipment | 16 | 4.1 |
| Museums | 15 | 4.6 |
| Clothing stores | 14 | 4.6 |
| Post office | 14 | 1.8 |
| Religion | 14 | 4.5 |
| Pizza | 13 | 4.3 |
| Concert halls and theaters | 12 | 4.5 |
| Car repair | 12 | 4.6 |
| Beauty salons | 12 | 4.7 |
| Hairdressers | 12 | 4.7 |
| Freight/commercial transport | 11 | 4.5 |
| Technical construction services | 10 | 4.3 |
| Gas station | 10 | 4 |
Narni Facts
| Area | 2.1 km² |
| Population | 4,722 |
| Male Population | 2,246 (47.6%) |
| Female Population | 2,476 (52.4%) |
| Population change (1975 to 2020) | -4.4% |
| Population change (2000 to 2020) | -1.7% |
| Median Age | 44.4 years (Male: 43.9, Female: 45) |
| Local Time | |
| Timezone | Central European Summer Time |
| Lat & Lng | 42.51956, 12.52758 |
Map of Narni
Interactive Map
Narni Population
Years 1975 to 2020
| Data | 1975 | 1990 | 2000 | 2015 | 2020 |
|---|---|---|---|---|---|
| Population | 4,938 | 4,965 | 4,806 | 4,651 | 4,722 |
| Population Density | 2,323.8 / km² | 2,336.5 / km² | 2,261.6 / km² | 2,188.7 / km² | 2,222.1 / km² |
Narni Population change from 2000 to 2015
Decrease of 3.2% from year 2000 to 2015
| Location | Change since 1975 | Change since 1990 | Change since 2000 |
|---|---|---|---|
| Narni | -5.8% | -6.3% | -3.2% |
| Italy | +8.3% | +4.9% | +4.7% |
Narni Median Age
Median Age: 44.4 years
| Location | Median Age | Median Age (Female) | Median Age (Male) |
|---|---|---|---|
| Narni | 44.4 yrs | 45 yrs | 43.9 yrs |
| Italy | 40.9 yrs | 41.5 yrs | 40.3 yrs |
Narni Population Density
Population Density: 2,222 / km²
| Location | Population | Area | Density |
|---|---|---|---|
| Narni | 4,722 | 2.125 km² | 2,222 / km² |
| Italy | 59.3 million | 301,510.7 km² | 197 / km² |
Narni Historical and Projected Population
Estimated Population from 0 to 2100
- JRC (European Commission's Joint Research Centre) work on the GHS built-up grid
- CIESIN (Center for International Earth Science Information Network)
- [Link] Klein Goldewijk, K., Beusen, A., Doelman, J., and Stehfest, E.: Anthropogenic land use estimates for the Holocene – HYDE 3.2, Earth Syst. Sci. Data, 9, 927–953, https://doi.org/10.5194/essd-9-927-2017, 2017.
Area Codes
Percentage Area Codes used by businesses in Narni
Price Distribution
Business distribution by price for Narni
Human Development Index (HDI)
Statistic composite index of life expectancy, education, and per capita income.
Narni CO2 Emissions
Carbon Dioxide (CO2) Emissions Per Capita in Tonnes Per Year
| Location | CO2 Emissions | CO2 Emissions Per Capita | CO2 Emissions Intensity |
|---|---|---|---|
| Narni | 35,001 tn | 7.41 tn | 16,471 tons/km² |
| Italy | 399,008,505 tn | 6.73 tn | 1,323.4 tons/km² |
| 2013 CO2 emissions (tonnes/year) | 35,001 tn |
| 2013 CO2 emissions (tonnes/year) per capita | 7.41 tn |
| 2013 CO2 emissions intensity (tonnes/km²/year) | 16,471 tons/km² |
Natural Hazards Risk
Relative risk out of 10
| Hazard | Risk Level |
|---|---|
| Earthquake | Medium (6) |
* Risk, particularly concerning flood or landslide, may not be for the entire area.
- Dilley, M., R.S. Chen, U. Deichmann, A.L. Lerner-Lam, M. Arnold, J. Agwe, P. Buys, O. Kjekstad, B. Lyon, and G. Yetman. 2005. Natural Disaster Hotspots: A Global Risk Analysis. Washington, D.C.: World Bank. https://doi.org/10.1596/0-8213-5930-4.
- Center for Hazards and Risk Research - CHRR - Columbia University, Center for International Earth Science Information Network - CIESIN - Columbia University. 2005. Global Earthquake Hazard Distribution - Peak Ground Acceleration. Palisades, NY: NASA Socioeconomic Data and Applications Center (SEDAC). https://doi.org/10.7927/H4BZ63ZS.
Recent Nearby Earthquakes
Magnitude 3.0 and greater
| Date▼ | Time↕ | Magnitude↕ | Distance↕ | Depth↕ | Location↕ | Link |
|---|---|---|---|---|---|---|
| 1/2/17 | 3:36 AM | 4.3 | 34.9 km | 10,000 m | 4km SW of Campello sul Clitunno, Italy | usgs.gov |
| 7/13/11 | 9:55 AM | 3.6 | 18 km | 7,600 m | central Italy | usgs.gov |
| 7/10/11 | 6:13 PM | 3.2 | 42.7 km | 2,600 m | central Italy | usgs.gov |
| 8/28/10 | 7:08 AM | 4.3 | 37.8 km | 8,200 m | central Italy | usgs.gov |
| 6/24/06 | 7:16 AM | 3.1 | 9.8 km | 10,000 m | central Italy | usgs.gov |
| 6/24/06 | 6:35 AM | 3.2 | 11.1 km | 2,600 m | central Italy | usgs.gov |
| 6/22/06 | 12:32 AM | 3 | 11.5 km | 4,400 m | central Italy | usgs.gov |
| 5/16/06 | 9:02 PM | 3.6 | 8.4 km | 10,000 m | central Italy | usgs.gov |
| 3/31/06 | 10:48 PM | 3.2 | 31.5 km | 4,000 m | central Italy | usgs.gov |
| 2/9/06 | 1:01 AM | 3.1 | 34.7 km | 8,100 m | central Italy | usgs.gov |
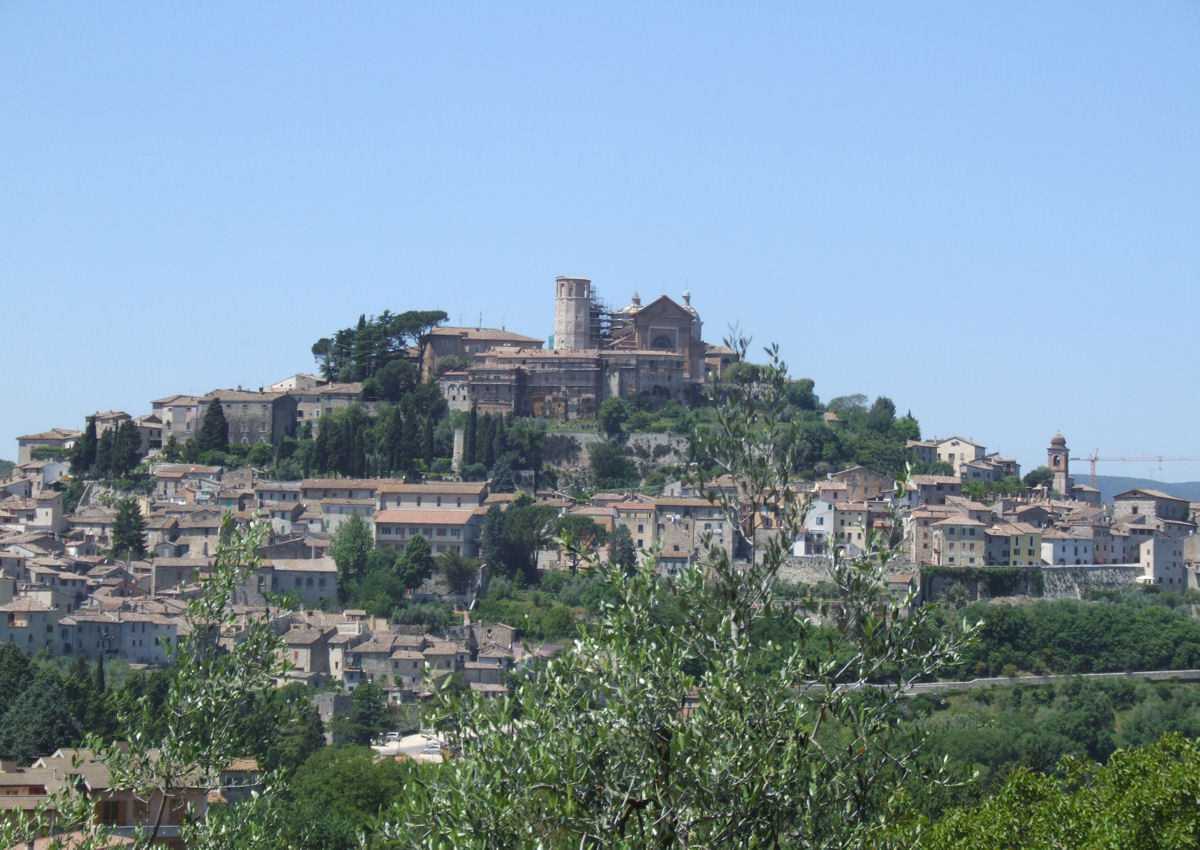
Narni
Narni (in Latin, Narnia) is an ancient hilltown and comune of Umbria, in central Italy, with 20,385 inhabitants (2008 census). At an altitude of 240 m (787 ft), it overhangs a narrow gorge of the Nera River in the province of Terni. It is very close ..
Narni Wikipedia Page


About Our Data
The data on this page is estimated using a number of publicly available tools and resources. It is provided without warranty, and could contain inaccuracies. Use at your own risk.