Onifai Facts
| Area | 0.4 km² |
| Population | 688 |
| Male Population | 345 (50.1%) |
| Female Population | 343 (49.9%) |
| Population change (1975 to 2020) | -18.2% |
| Population change (2000 to 2020) | -7.9% |
| Median Age | 42.7 years (Male: 42.5, Female: 42.9) |
| Local Time | |
| Timezone | Central European Summer Time |
| Lat & Lng | 40.40694, 9.65005 |
Map of Onifai
Interactive Map
Onifai Population
Years 1975 to 2020
| Data | 1975 | 1990 | 2000 | 2015 | 2020 |
|---|---|---|---|---|---|
| Population | 841 | 796 | 747 | 698 | 688 |
| Population Density | 2,242.7 / km² | 2,122.7 / km² | 1,992 / km² | 1,861.3 / km² | 1,834.7 / km² |
Onifai Population change from 2000 to 2015
Decrease of 6.6% from year 2000 to 2015
| Location | Change since 1975 | Change since 1990 | Change since 2000 |
|---|---|---|---|
| Onifai | -17% | -12.3% | -6.6% |
| Italy | +8.3% | +4.9% | +4.7% |
Onifai Median Age
Median Age: 42.7 years
| Location | Median Age | Median Age (Female) | Median Age (Male) |
|---|---|---|---|
| Onifai | 42.7 yrs | 42.9 yrs | 42.5 yrs |
| Italy | 40.9 yrs | 41.5 yrs | 40.3 yrs |
Onifai Population Density
Population Density: 1,835 / km²
| Location | Population | Area | Density |
|---|---|---|---|
| Onifai | 688 | 0.375 km² | 1,835 / km² |
| Italy | 59.3 million | 301,510.7 km² | 197 / km² |
Onifai Historical and Projected Population
Estimated Population from 0 to 2100
- JRC (European Commission's Joint Research Centre) work on the GHS built-up grid
- CIESIN (Center for International Earth Science Information Network)
- [Link] Klein Goldewijk, K., Beusen, A., Doelman, J., and Stehfest, E.: Anthropogenic land use estimates for the Holocene – HYDE 3.2, Earth Syst. Sci. Data, 9, 927–953, https://doi.org/10.5194/essd-9-927-2017, 2017.
Area Codes
Percentage Area Codes used by businesses in Onifai
Human Development Index (HDI)
Statistic composite index of life expectancy, education, and per capita income.
Onifai CO2 Emissions
Carbon Dioxide (CO2) Emissions Per Capita in Tonnes Per Year
| Location | CO2 Emissions | CO2 Emissions Per Capita | CO2 Emissions Intensity |
|---|---|---|---|
| Onifai | 3,884 tn | 5.65 tn | 10,358 tons/km² |
| Italy | 399,008,505 tn | 6.73 tn | 1,323.4 tons/km² |
| 2013 CO2 emissions (tonnes/year) | 3,884 tn |
| 2013 CO2 emissions (tonnes/year) per capita | 5.65 tn |
| 2013 CO2 emissions intensity (tonnes/km²/year) | 10,358 tons/km² |
Recent Nearby Earthquakes
Magnitude 3.0 and greater
| Date▼ | Time↕ | Magnitude↕ | Distance↕ | Depth↕ | Location↕ | Link |
|---|---|---|---|---|---|---|
| 2/5/09 | 4:02 PM | 4.3 | 59.5 km | 12,700 m | Tyrrhenian Sea | usgs.gov |
| 11/25/05 | 7:46 PM | 3 | 70.6 km | 10,000 m | Tyrrhenian Sea | usgs.gov |
| 12/18/04 | 9:12 AM | 5.1 | 68.4 km | 10,000 m | Tyrrhenian Sea | usgs.gov |
| 12/12/04 | 11:52 AM | 4.3 | 63.8 km | 10,000 m | Tyrrhenian Sea | usgs.gov |
| 12/12/04 | 11:52 AM | 3.8 | 65.4 km | 10,000 m | Tyrrhenian Sea | usgs.gov |
| 2/10/02 | 4:21 PM | 3.9 | 80.9 km | 10,000 m | Tyrrhenian Sea | usgs.gov |
| 12/20/01 | 4:05 PM | 3.5 | 89.7 km | 10,000 m | Sardinia, Italy | usgs.gov |
| 4/21/01 | 5:31 PM | 3.9 | 70 km | 10,000 m | Corsica, France | usgs.gov |
| 3/3/01 | 1:54 AM | 4.8 | 56.5 km | 10,000 m | Tyrrhenian Sea | usgs.gov |
| 6/27/00 | 4:07 AM | 4.3 | 68.4 km | 10,000 m | Tyrrhenian Sea | usgs.gov |
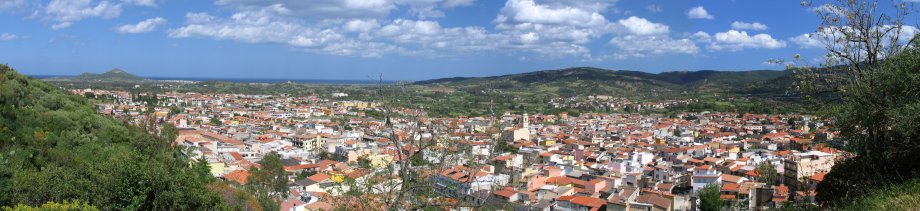
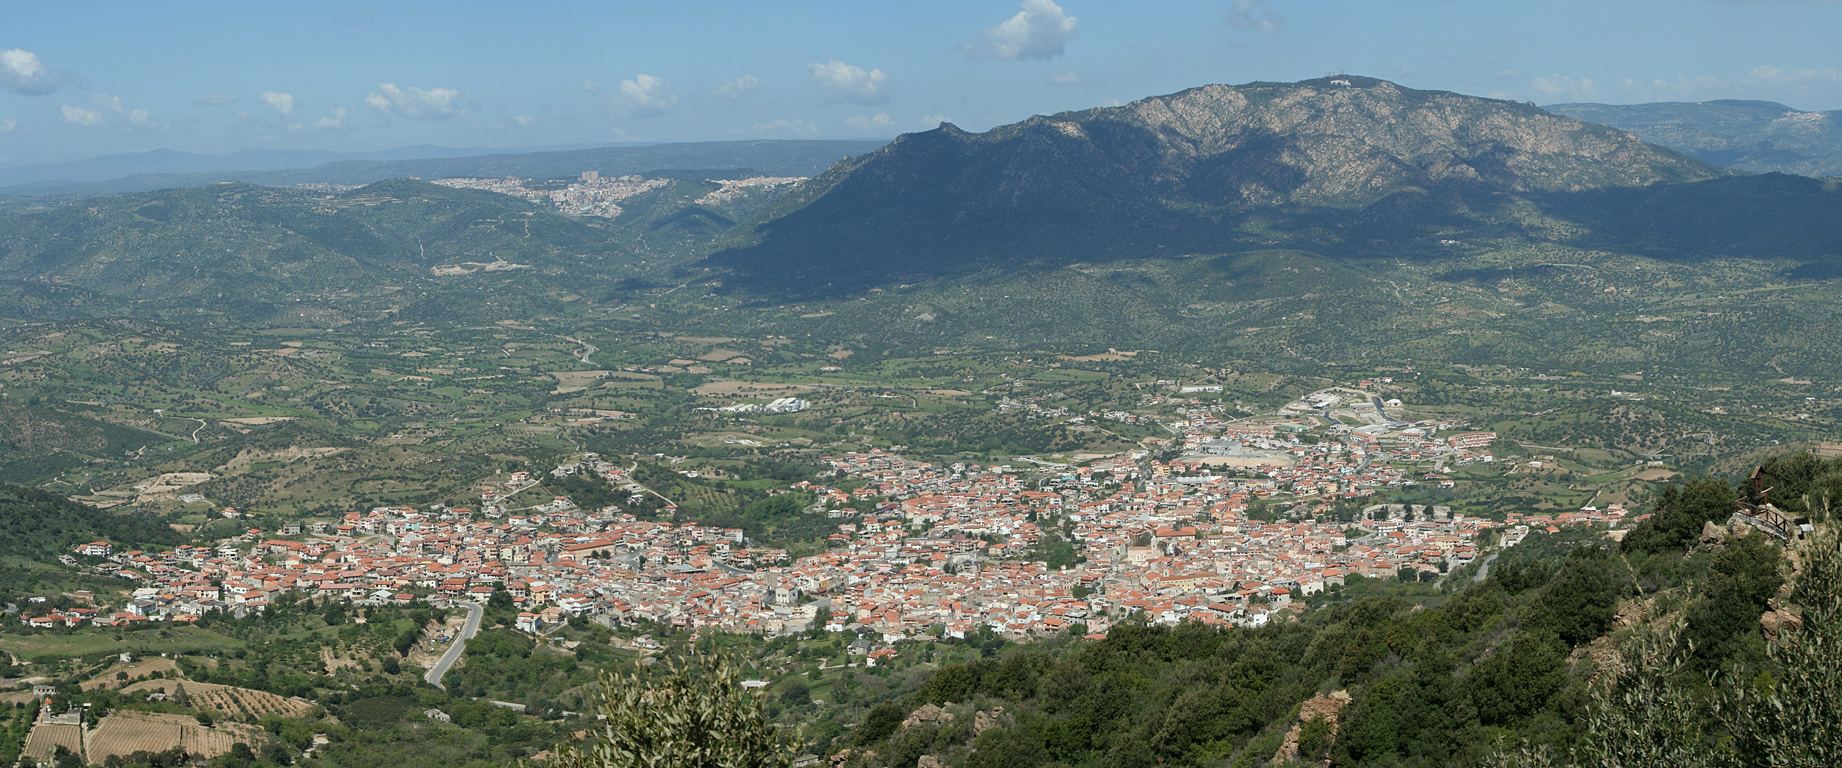
Onifai
Onifai (Sardinian: Oniài) is a comune (municipality) in the Province of Nuoro in the Italian region of Sardinia, located about 200 kilometres (120 mi) north of Cagliari, about 40 kilometres (25 mi) east of Nuoro and just 5 kilometres (3 mi) inland fr..
Onifai Wikipedia Page
About Our Data
The data on this page is estimated using a number of publicly available tools and resources. It is provided without warranty, and could contain inaccuracies. Use at your own risk.