Categories in Oulx
Industries
Business Distribution by Industry in Oulx
| Industry Description | Number of Establishments | Average Google Rating |
|---|---|---|
| Shopping | 41 | 4 |
| Restaurants | 27 | 4.4 |
| Other accommodation | 17 | 4.6 |
| Pizza | 14 | 4.4 |
| Bars, pubs and taverns | 13 | 4.4 |
| Sports and recreation | 12 | 4.5 |
| Real estate | 11 | 3.9 |
| Grocery stores and supermarkets | 11 | 3.9 |
| Cafes | 10 | 4.5 |
| All food and beverage | 9 | 3.9 |
| Car repair | 8 | 4.3 |
| Clothing stores | 8 | 4 |
| General contractors | 7 | 4.7 |
| Financial services | 7 | 4.9 |
| Churches | 7 | 4.8 |
| Education | 7 | 3.9 |
| Religion | 7 | 4.6 |
| Plumbing installation and repair | 6 | 4.8 |
| Tobacco stores | 6 | 5 |
| Hotels and motels | 6 | 4.6 |
| Bed and breakfasts | 6 | 4.6 |
| Hardware store | 6 | 4.5 |
| Bakeries | 6 | 4.5 |
| Electrical installation | 6 | 4.4 |
| Beauty salons | 6 | 4.5 |
Oulx Facts
| Area | 1.3 km² |
| Population | 1,910 |
| Male Population | 1,011 (52.9%) |
| Female Population | 899 (47.1%) |
| Population change (1975 to 2020) | +83.0% |
| Population change (2000 to 2020) | +23.5% |
| Median Age | 40.7 years (Male: 38.4, Female: 42.8) |
| Neighborhoods | Gad |
| Local Time | |
| Timezone | Central European Summer Time |
| Lat & Lng | 45.03641, 6.83372 |
Map of Oulx
Interactive Map
Oulx Population
Years 1975 to 2020
| Data | 1975 | 1990 | 2000 | 2015 | 2020 |
|---|---|---|---|---|---|
| Population | 1,044 | 1,342 | 1,546 | 1,967 | 1,910 |
| Population Density | 835.2 / km² | 1,073.6 / km² | 1,236.8 / km² | 1,573.6 / km² | 1,528 / km² |
Oulx Population change from 2000 to 2015
Increase of 27.2% from year 2000 to 2015
| Location | Change since 1975 | Change since 1990 | Change since 2000 |
|---|---|---|---|
| Oulx | +88.4% | +46.6% | +27.2% |
| Italy | +8.3% | +4.9% | +4.7% |
Oulx Median Age
Median Age: 40.7 years
| Location | Median Age | Median Age (Female) | Median Age (Male) |
|---|---|---|---|
| Oulx | 40.7 yrs | 42.8 yrs | 38.4 yrs |
| Italy | 40.9 yrs | 41.5 yrs | 40.3 yrs |
Oulx Population Density
Population Density: 1,528 / km²
| Location | Population | Area | Density |
|---|---|---|---|
| Oulx | 1,910 | 1.25 km² | 1,528 / km² |
| Italy | 59.3 million | 301,510.7 km² | 197 / km² |
Oulx Historical and Projected Population
Estimated Population from 0 to 2100
- JRC (European Commission's Joint Research Centre) work on the GHS built-up grid
- CIESIN (Center for International Earth Science Information Network)
- [Link] Klein Goldewijk, K., Beusen, A., Doelman, J., and Stehfest, E.: Anthropogenic land use estimates for the Holocene – HYDE 3.2, Earth Syst. Sci. Data, 9, 927–953, https://doi.org/10.5194/essd-9-927-2017, 2017.
Area Codes
Percentage Area Codes used by businesses in Oulx
Price Distribution
Business distribution by price for Oulx
Human Development Index (HDI)
Statistic composite index of life expectancy, education, and per capita income.
Oulx CO2 Emissions
Carbon Dioxide (CO2) Emissions Per Capita in Tonnes Per Year
| Location | CO2 Emissions | CO2 Emissions Per Capita | CO2 Emissions Intensity |
|---|---|---|---|
| Oulx | 15,702 tn | 8.22 tn | 12,562 tons/km² |
| Italy | 399,008,505 tn | 6.73 tn | 1,323.4 tons/km² |
| 2013 CO2 emissions (tonnes/year) | 15,702 tn |
| 2013 CO2 emissions (tonnes/year) per capita | 8.22 tn |
| 2013 CO2 emissions intensity (tonnes/km²/year) | 12,562 tons/km² |
Natural Hazards Risk
Relative risk out of 10
| Hazard | Risk Level |
|---|---|
| Flood | High (8) |
| Earthquake | Medium (5) |
| Landslide | Medium (6) |
* Risk, particularly concerning flood or landslide, may not be for the entire area.
- Dilley, M., R.S. Chen, U. Deichmann, A.L. Lerner-Lam, M. Arnold, J. Agwe, P. Buys, O. Kjekstad, B. Lyon, and G. Yetman. 2005. Natural Disaster Hotspots: A Global Risk Analysis. Washington, D.C.: World Bank. https://doi.org/10.1596/0-8213-5930-4.
- Center for Hazards and Risk Research - CHRR - Columbia University, Center for International Earth Science Information Network - CIESIN - Columbia University, and Norwegian Geotechnical Institute - NGI. 2005. Global Landslide Hazard Distribution. Palisades, NY: NASA Socioeconomic Data and Applications Center (SEDAC). https://doi.org/10.7927/H4P848VZ.
- Center for Hazards and Risk Research - CHRR - Columbia University, Center for International Earth Science Information Network - CIESIN - Columbia University. 2005. Global Flood Hazard Frequency and Distribution. Palisades, NY: NASA Socioeconomic Data and Applications Center (SEDAC). https://doi.org/10.7927/H4668B3D.
- Center for Hazards and Risk Research - CHRR - Columbia University, Center for International Earth Science Information Network - CIESIN - Columbia University. 2005. Global Earthquake Hazard Distribution - Peak Ground Acceleration. Palisades, NY: NASA Socioeconomic Data and Applications Center (SEDAC). https://doi.org/10.7927/H4BZ63ZS.
Recent Nearby Earthquakes
Magnitude 3.0 and greater
| Date▼ | Time↕ | Magnitude↕ | Distance↕ | Depth↕ | Location↕ | Link |
|---|---|---|---|---|---|---|
| 7/30/16 | 8:21 PM | 4.2 | 31.5 km | 11,000 m | 1km W of Pinasca, Italy | usgs.gov |
| 9/10/15 | 7:32 AM | 3.1 | 35.4 km | 11,000 m | 0km NW of Villar Pellice, Italy | usgs.gov |
| 4/7/14 | 7:27 PM | 4.8 | 49.1 km | 8,070 m | 7km SE of Guillestre, France | usgs.gov |
| 1/7/13 | 4:20 AM | 4.1 | 33.6 km | 7,000 m | France | usgs.gov |
| 7/25/11 | 12:31 PM | 4.4 | 36 km | 25,100 m | northern Italy | usgs.gov |
| 10/24/07 | 10:43 PM | 3.5 | 35.8 km | 16,600 m | northern Italy | usgs.gov |
| 10/5/07 | 6:05 AM | 3.7 | 24.2 km | 2,000 m | France | usgs.gov |
| 8/20/07 | 5:12 PM | 3.5 | 48.3 km | 13,400 m | northern Italy | usgs.gov |
| 1/3/07 | 1:14 PM | 3.4 | 46.8 km | 2,000 m | France | usgs.gov |
| 8/8/06 | 1:12 PM | 3.1 | 24.2 km | 2,000 m | France | usgs.gov |
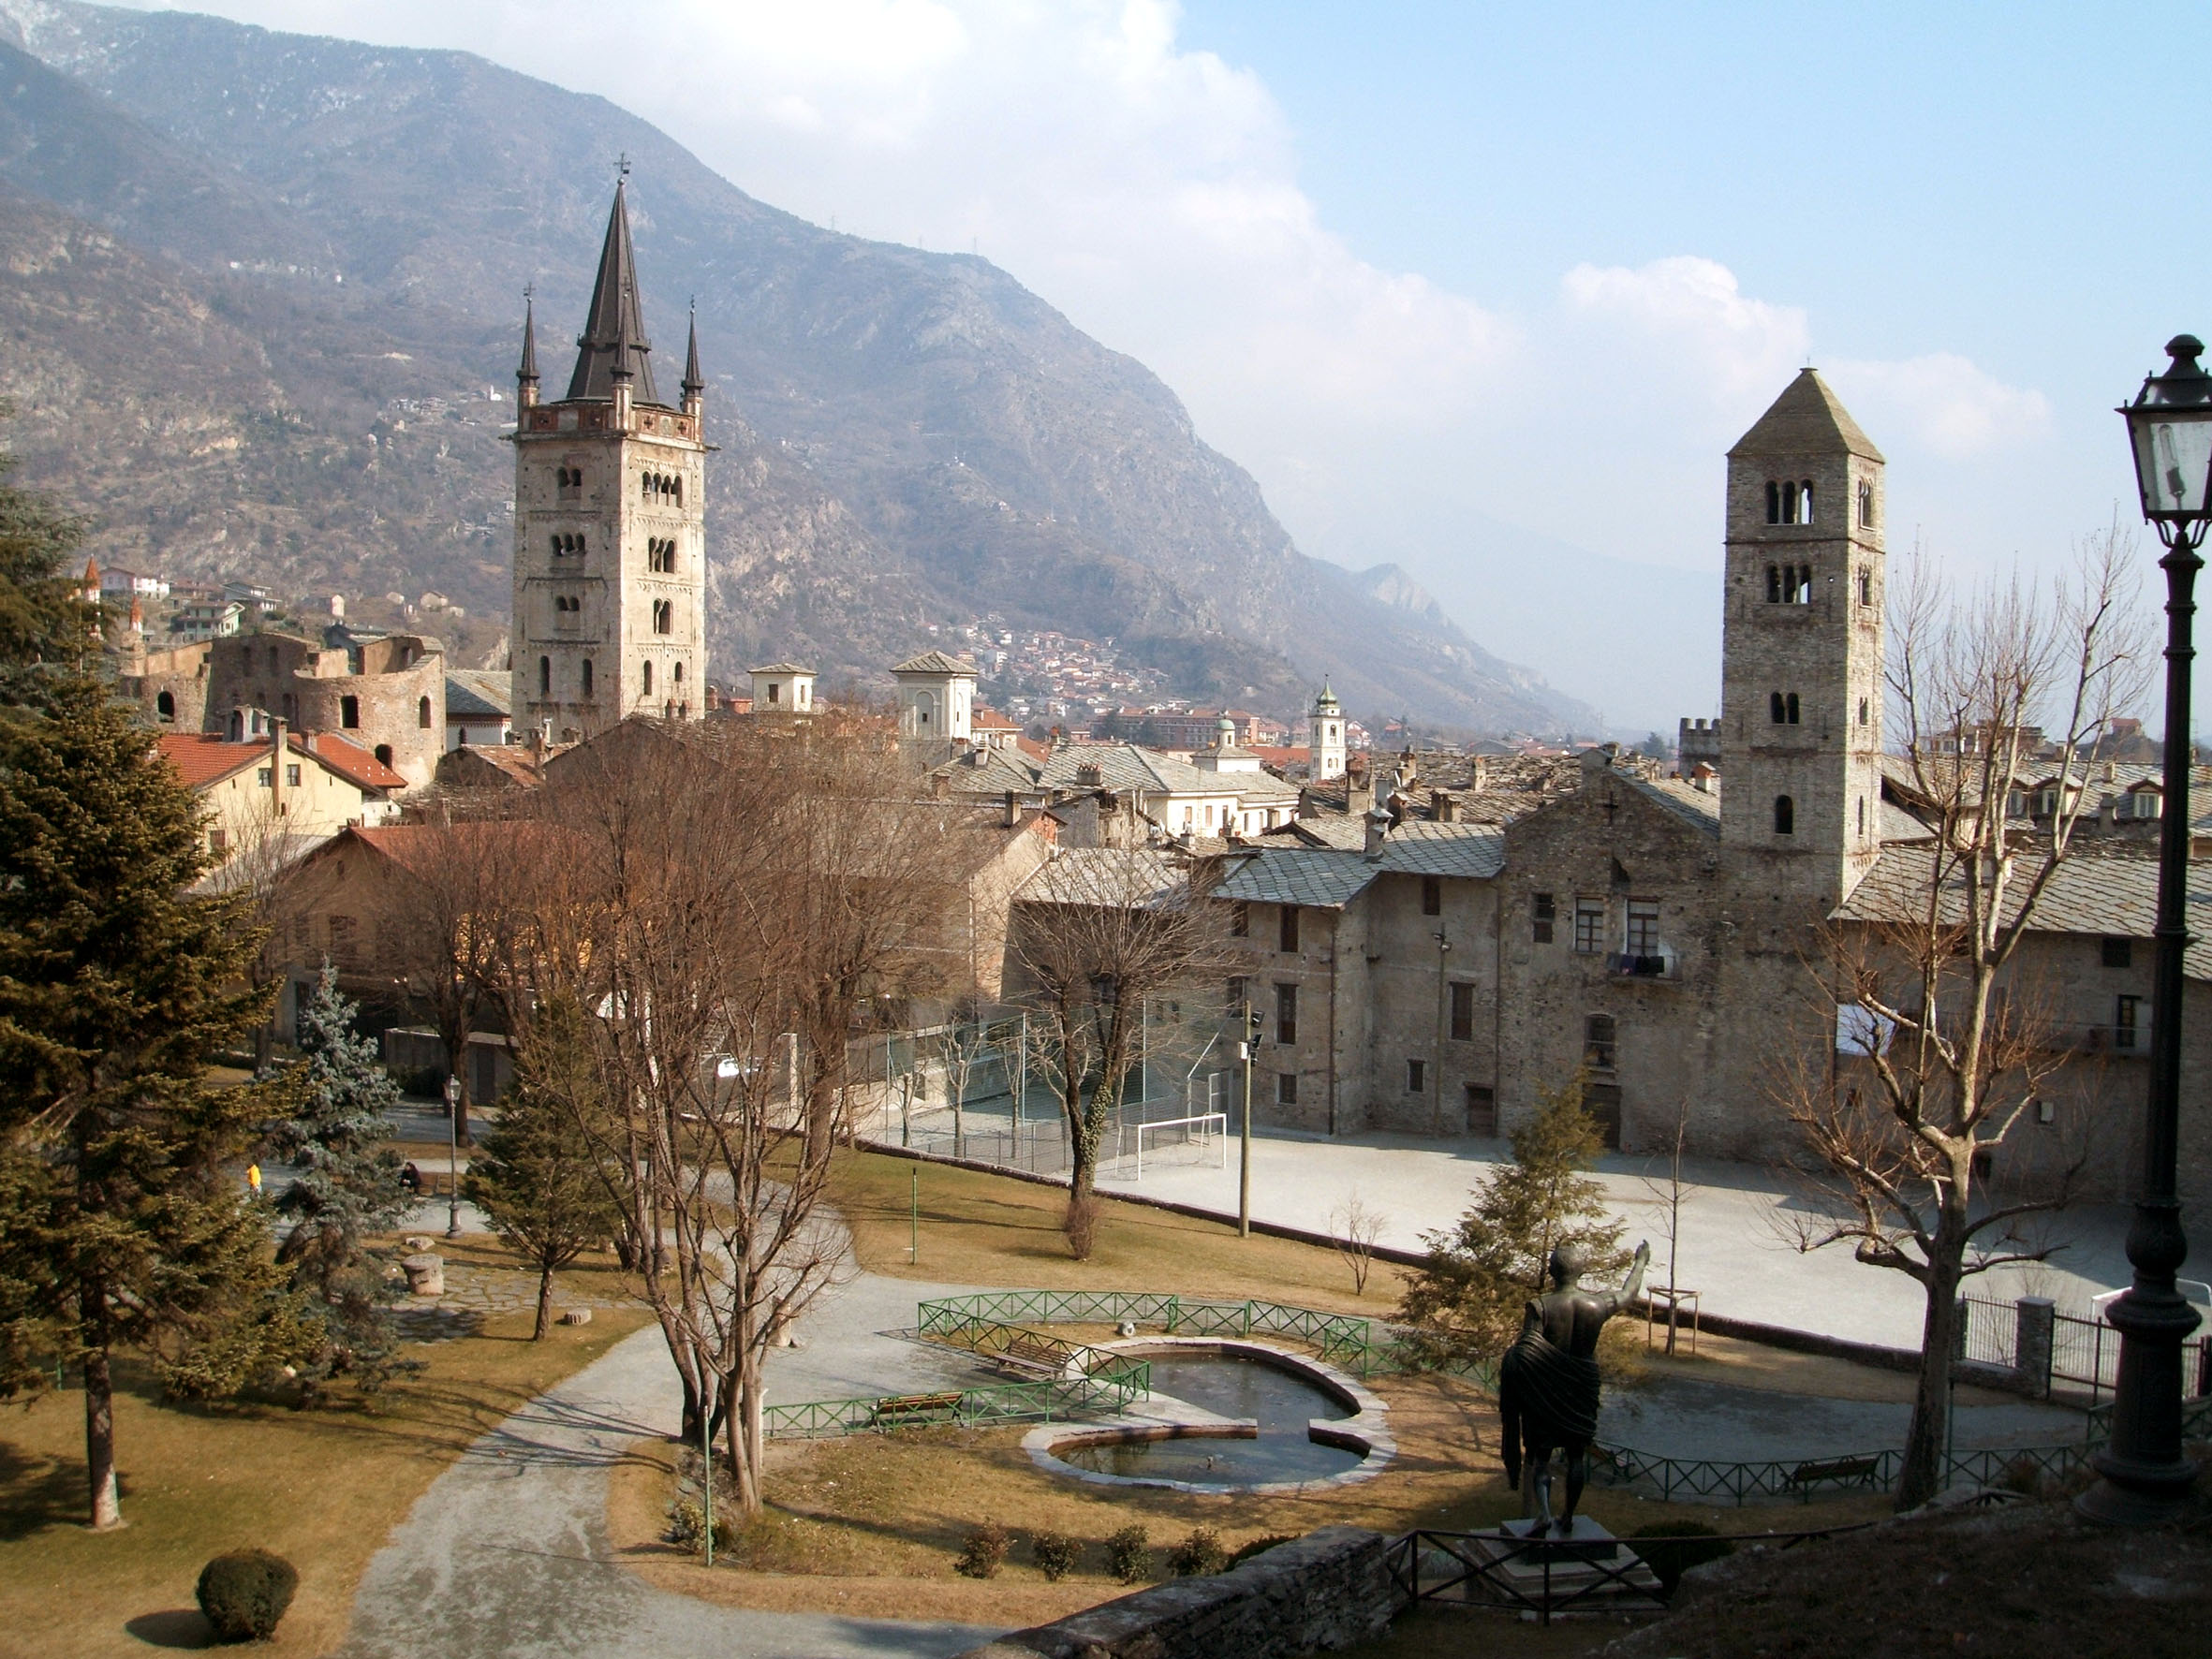
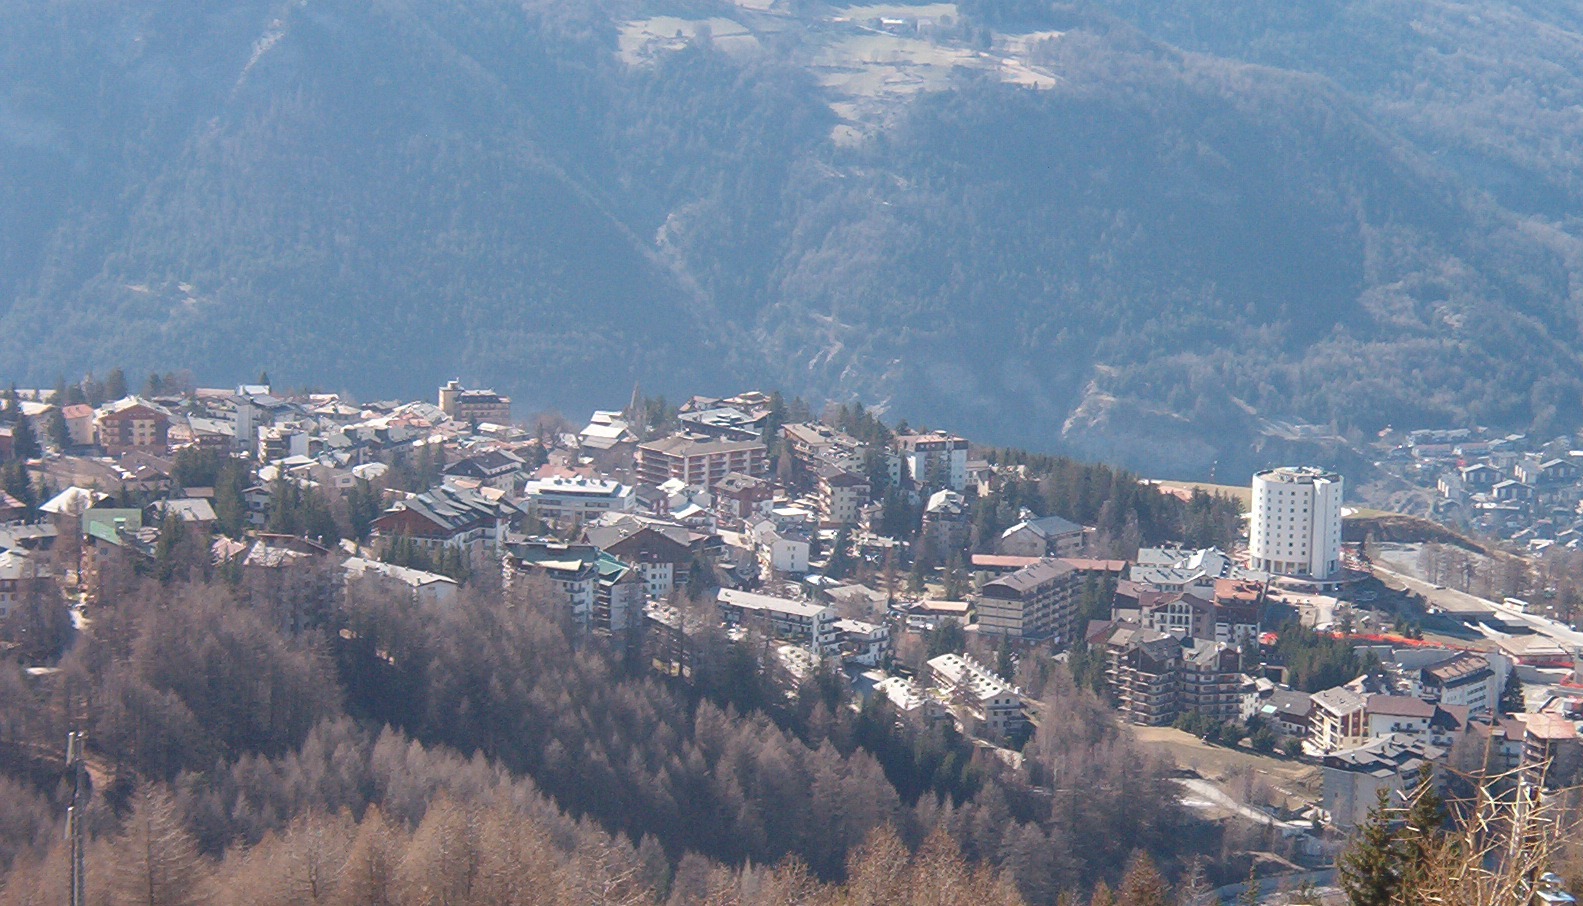
Oulx
Oulx (Ors in occitan) is a comune (municipality) in the Metropolitan City of Turin in the Italian region Piedmont, located about 70 kilometres (43 mi) west of Turin, in the Susa Valley on the border with France.
Oulx Wikipedia Page

About Our Data
The data on this page is estimated using a number of publicly available tools and resources. It is provided without warranty, and could contain inaccuracies. Use at your own risk.