Categories in Pienza
Industries
Business Distribution by Industry in Pienza
| Industry Description | Number of Establishments | Average Google Rating |
|---|---|---|
| Other accommodation | 102 | 4.6 |
| Shopping | 47 | 4.5 |
| Bed and breakfasts | 38 | 4.6 |
| Restaurants | 34 | 4.4 |
| Grocery stores and supermarkets | 30 | 4.5 |
| All food and beverage | 29 | 4.5 |
| Italian restaurants | 23 | 4.4 |
| Hotels and motels | 21 | 4.5 |
| Bars, pubs and taverns | 16 | 4.3 |
| Travel agencies | 10 | 4.5 |
| Tractors and farm equipment | 9 | 4.7 |
| Cheese, dairy and eggs | 9 | 4.7 |
| Wine, beer and liquor stores | 8 | 4.6 |
| Cafes | 7 | 4.3 |
| Holiday homes, cabins and resorts | 7 | 4.7 |
| Shopping other | 6 | 4.7 |
| Churches | 6 | 4.5 |
| Hostels | 5 | 4.7 |
| Ice cream and yogurt shops | 5 | 4.8 |
| Clothing stores | 5 | 4.8 |
| Museums | 5 | 4.5 |
| Gifts, cards and party supplies | 5 | 4.8 |
Pienza Facts
| Area | 0.4 km² |
| Population | 1,133 |
| Male Population | 541 (47.8%) |
| Female Population | 592 (52.2%) |
| Population change (1975 to 2020) | -20.9% |
| Population change (2000 to 2020) | -9.4% |
| Median Age | 45.2 years (Male: 44.6, Female: 45.7) |
| Local Time | |
| Timezone | Central European Summer Time |
| Lat & Lng | 43.07873, 11.67671 |
Map of Pienza
Interactive Map
Pienza Population
Years 1975 to 2020
| Data | 1975 | 1990 | 2000 | 2015 | 2020 |
|---|---|---|---|---|---|
| Population | 1,433 | 1,343 | 1,251 | 1,149 | 1,133 |
| Population Density | 3,821.3 / km² | 3,581.3 / km² | 3,336 / km² | 3,064 / km² | 3,021.3 / km² |
Pienza Population change from 2000 to 2015
Decrease of 8.2% from year 2000 to 2015
| Location | Change since 1975 | Change since 1990 | Change since 2000 |
|---|---|---|---|
| Pienza | -19.8% | -14.4% | -8.2% |
| Italy | +8.3% | +4.9% | +4.7% |
Pienza Median Age
Median Age: 45.2 years
| Location | Median Age | Median Age (Female) | Median Age (Male) |
|---|---|---|---|
| Pienza | 45.2 yrs | 45.7 yrs | 44.6 yrs |
| Italy | 40.9 yrs | 41.5 yrs | 40.3 yrs |
Pienza Population Density
Population Density: 3,021 / km²
| Location | Population | Area | Density |
|---|---|---|---|
| Pienza | 1,133 | 0.375 km² | 3,021 / km² |
| Italy | 59.3 million | 301,510.7 km² | 197 / km² |
Pienza Historical and Projected Population
Estimated Population from 0 to 2100
- JRC (European Commission's Joint Research Centre) work on the GHS built-up grid
- CIESIN (Center for International Earth Science Information Network)
- [Link] Klein Goldewijk, K., Beusen, A., Doelman, J., and Stehfest, E.: Anthropogenic land use estimates for the Holocene – HYDE 3.2, Earth Syst. Sci. Data, 9, 927–953, https://doi.org/10.5194/essd-9-927-2017, 2017.
Area Codes
Percentage Area Codes used by businesses in Pienza
Price Distribution
Business distribution by price for Pienza
Human Development Index (HDI)
Statistic composite index of life expectancy, education, and per capita income.
Pienza CO2 Emissions
Carbon Dioxide (CO2) Emissions Per Capita in Tonnes Per Year
| Location | CO2 Emissions | CO2 Emissions Per Capita | CO2 Emissions Intensity |
|---|---|---|---|
| Pienza | 8,362 tn | 7.38 tn | 22,298.6 tons/km² |
| Italy | 399,008,505 tn | 6.73 tn | 1,323.4 tons/km² |
| 2013 CO2 emissions (tonnes/year) | 8,362 tn |
| 2013 CO2 emissions (tonnes/year) per capita | 7.38 tn |
| 2013 CO2 emissions intensity (tonnes/km²/year) | 22,298.6 tons/km² |
Natural Hazards Risk
Relative risk out of 10
| Hazard | Risk Level |
|---|---|
| Earthquake | Medium (6) |
* Risk, particularly concerning flood or landslide, may not be for the entire area.
- Dilley, M., R.S. Chen, U. Deichmann, A.L. Lerner-Lam, M. Arnold, J. Agwe, P. Buys, O. Kjekstad, B. Lyon, and G. Yetman. 2005. Natural Disaster Hotspots: A Global Risk Analysis. Washington, D.C.: World Bank. https://doi.org/10.1596/0-8213-5930-4.
- Center for Hazards and Risk Research - CHRR - Columbia University, Center for International Earth Science Information Network - CIESIN - Columbia University. 2005. Global Earthquake Hazard Distribution - Peak Ground Acceleration. Palisades, NY: NASA Socioeconomic Data and Applications Center (SEDAC). https://doi.org/10.7927/H4BZ63ZS.
Recent Nearby Earthquakes
Magnitude 3.0 and greater
| Date▼ | Time↕ | Magnitude↕ | Distance↕ | Depth↕ | Location↕ | Link |
|---|---|---|---|---|---|---|
| 6/15/19 | 5:31 PM | 3 | 24.4 km | 11,830 m | 4km SSW of Cetona, Italy | usgs.gov |
| 5/1/18 | 5:16 AM | 4.1 | 54.8 km | 10,000 m | 9km NNW of Chiusdino, Italy | usgs.gov |
| 5/30/16 | 8:24 PM | 4.4 | 47 km | 15,000 m | 1km WNW of Castel Giorgio, Italy | usgs.gov |
| 9/13/15 | 1:04 AM | 4.2 | 62.3 km | 4,110 m | 4km SW of Greve, Italy | usgs.gov |
| 3/3/15 | 11:51 PM | 3.3 | 70.1 km | 10,100 m | 3km N of Tavarnelle Val di Pesa, Italy | usgs.gov |
| 12/19/14 | 10:36 AM | 3.9 | 67.7 km | 7,100 m | 5km WNW of Greve, Italy | usgs.gov |
| 12/19/14 | 9:39 AM | 3.8 | 67.6 km | 9,300 m | 5km WNW of Greve, Italy | usgs.gov |
| 12/15/09 | 1:11 PM | 4.3 | 49.5 km | 9,200 m | central Italy | usgs.gov |
| 7/13/06 | 6:41 PM | 3.1 | 65.5 km | 9,900 m | central Italy | usgs.gov |
| 7/6/06 | 9:47 PM | 3.2 | 57.3 km | 3,100 m | central Italy | usgs.gov |
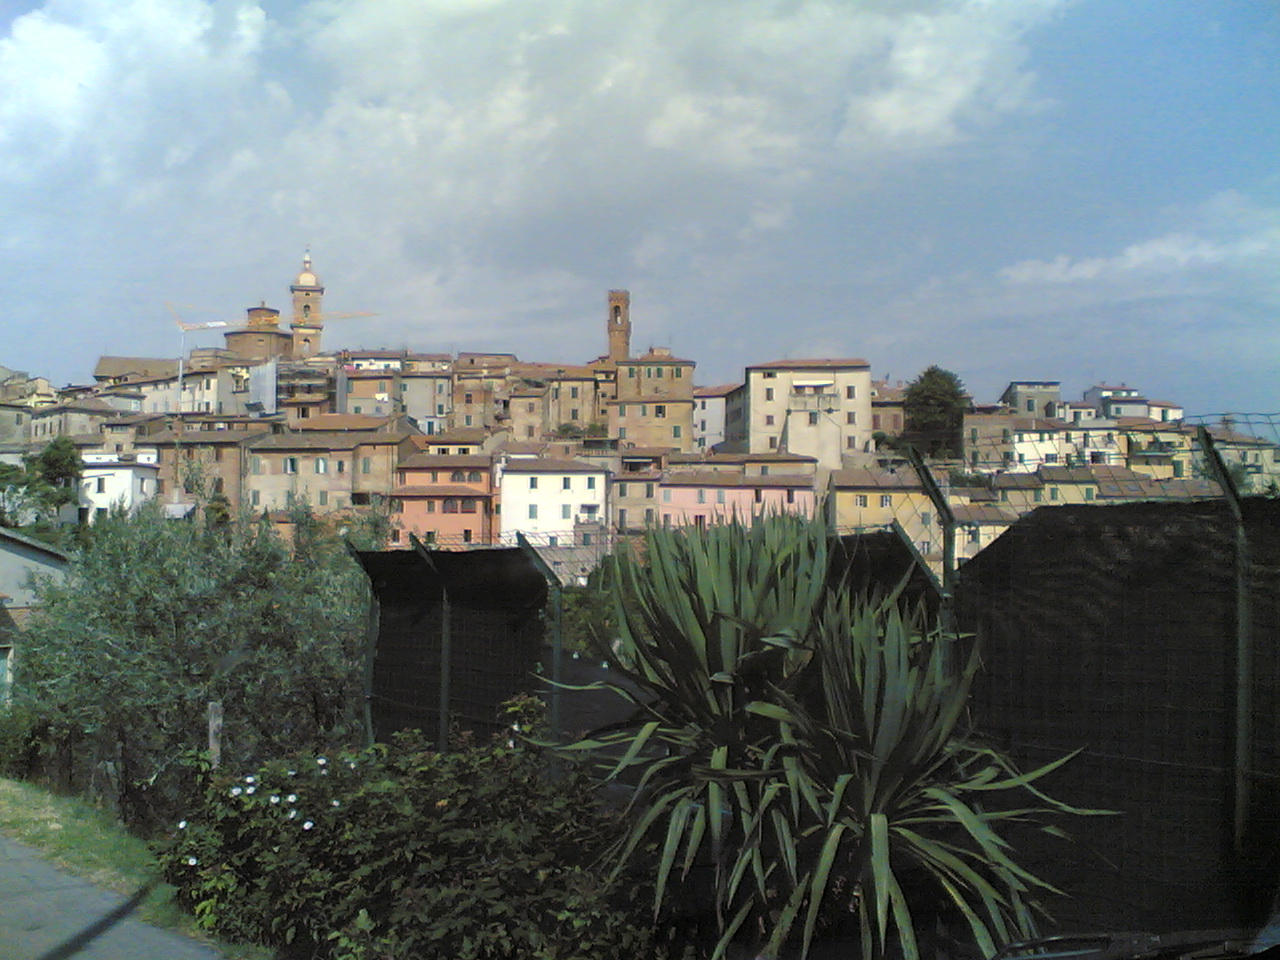
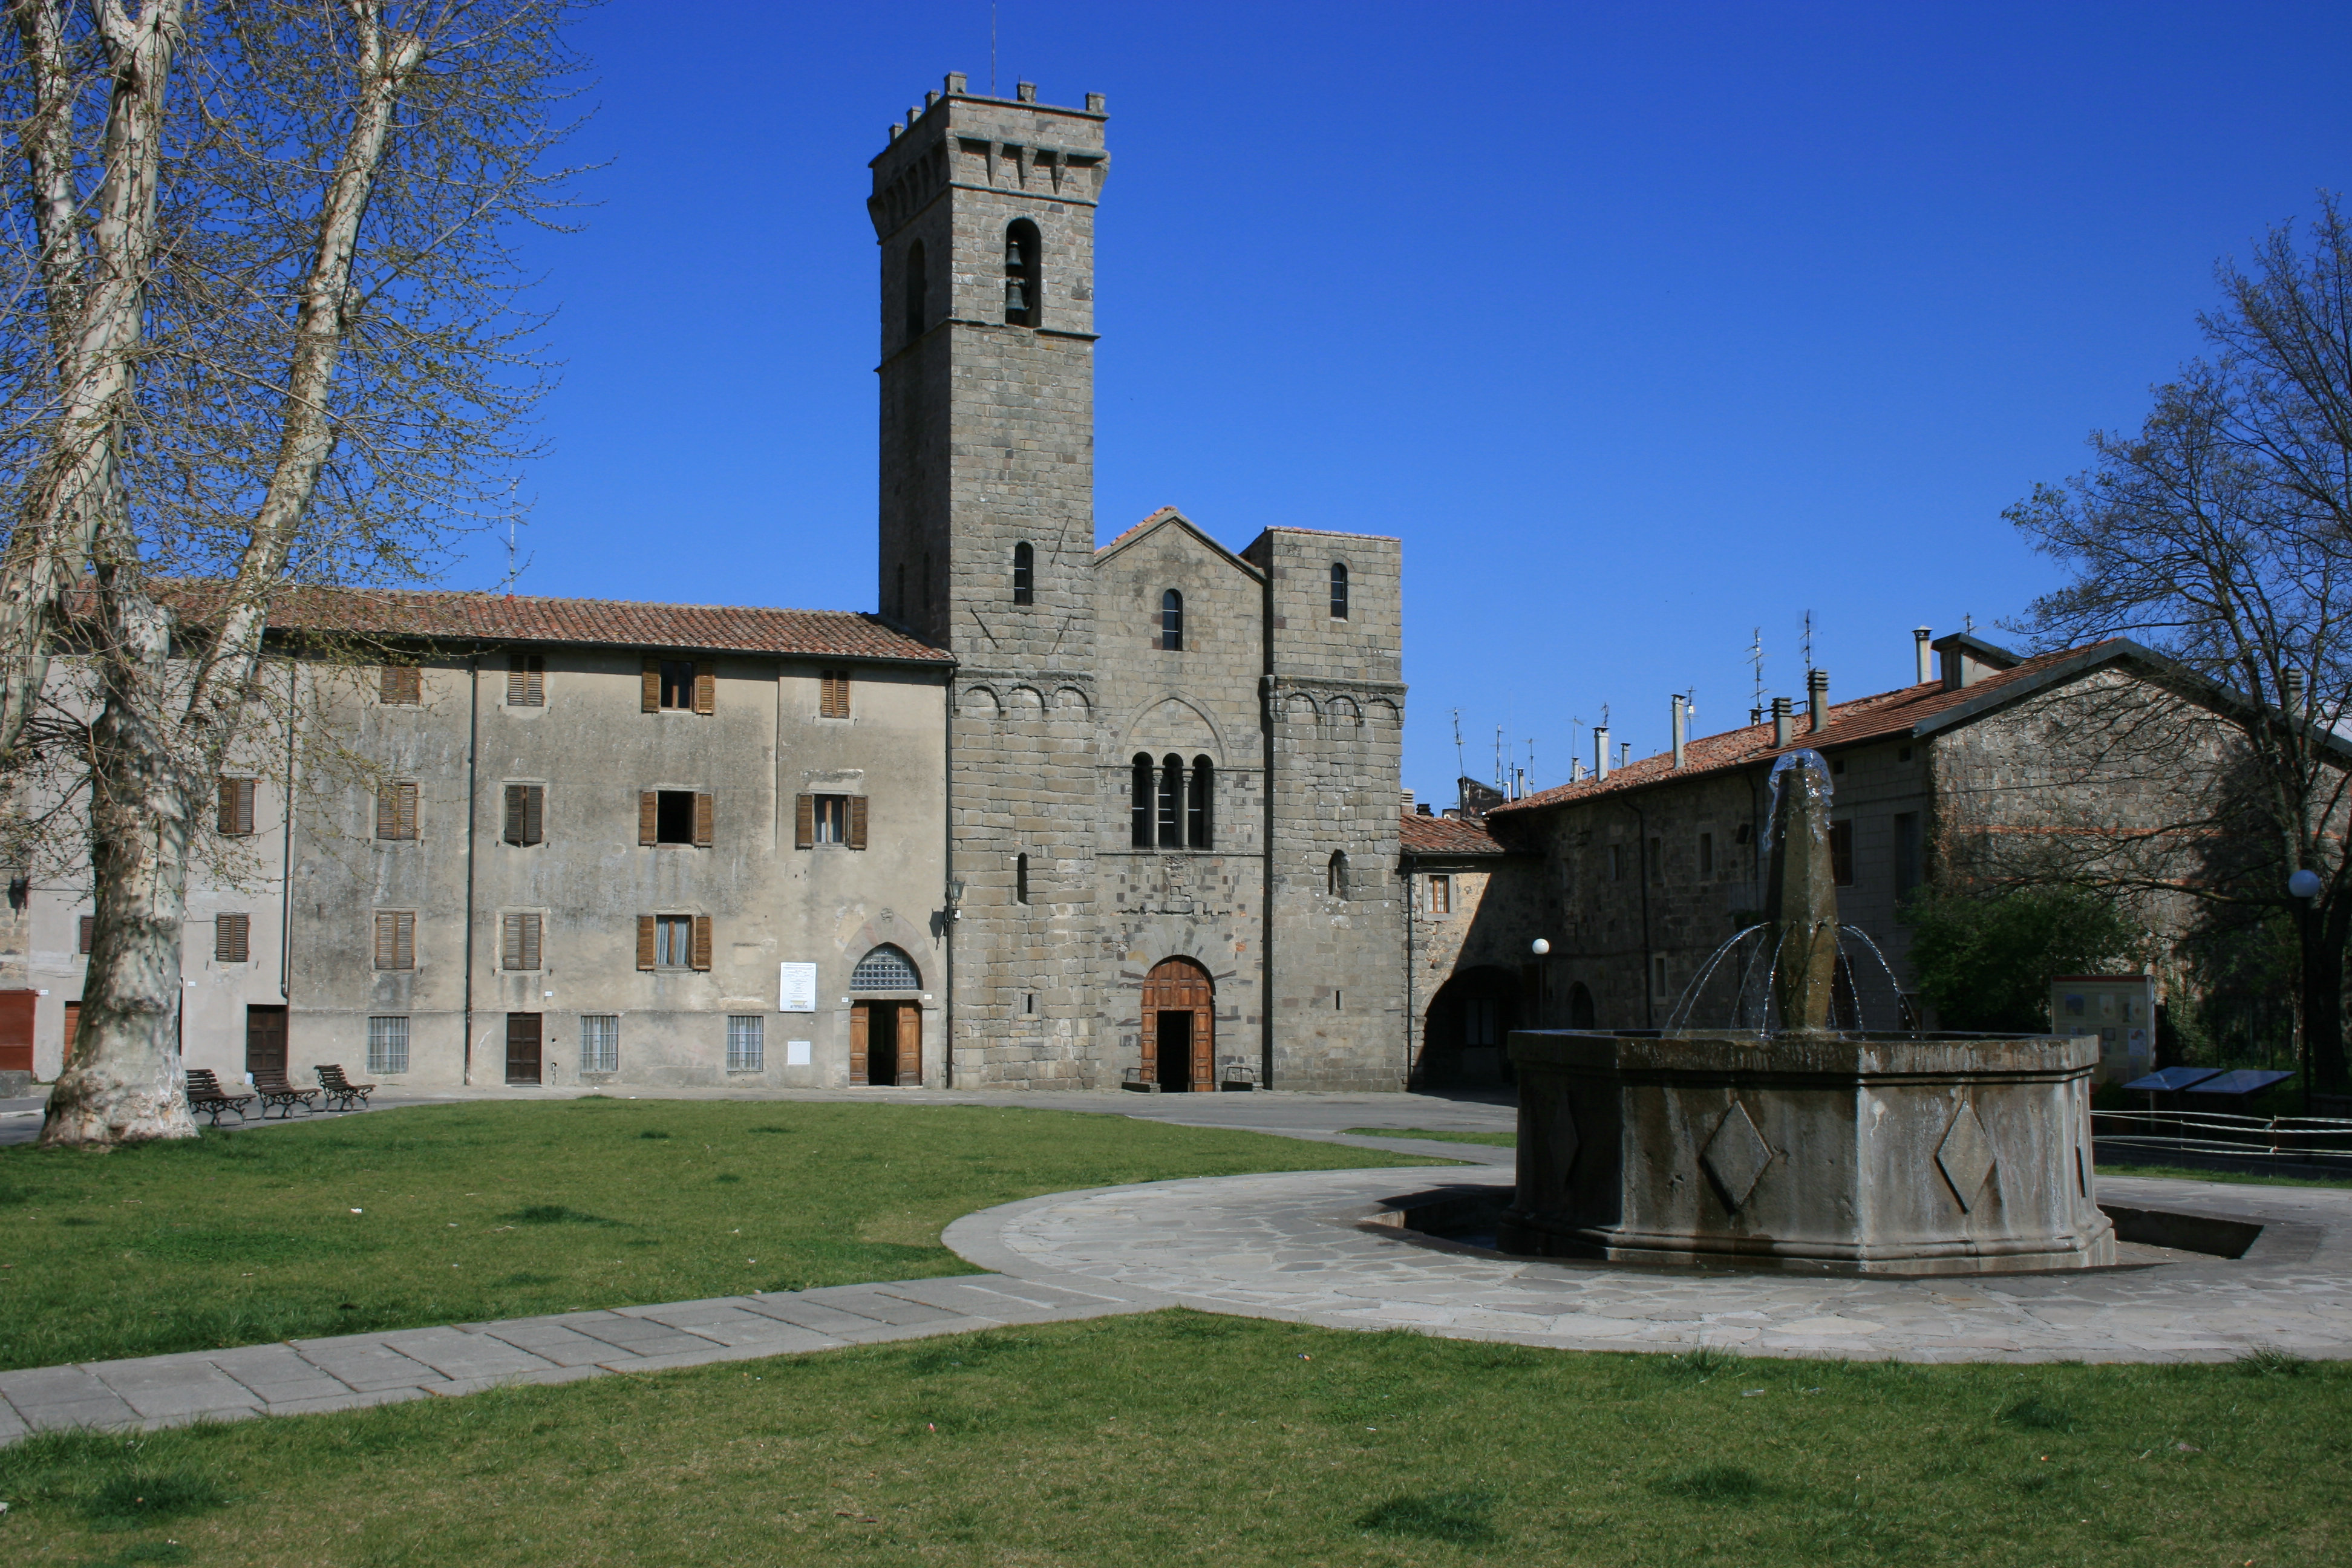
Pienza
Pienza, a town and comune in the province of Siena, in the Val d'Orcia in Tuscany (central Italy), between the towns of Montepulciano and Montalcino, is the "touchstone of Renaissance urbanism." 1996, UNESCO declared the town a World Heritage Site, ..
Pienza Wikipedia Page

About Our Data
The data on this page is estimated using a number of publicly available tools and resources. It is provided without warranty, and could contain inaccuracies. Use at your own risk.