Categories in Procida
Industries
Business Distribution by Industry in Procida
| Industry Description | Number of Establishments |
|---|---|
| Other accommodation | 93 |
| Shopping | 64 |
| Restaurants | 63 |
| Bed and breakfasts | 40 |
| Bars, pubs and taverns | 37 |
| Grocery stores and supermarkets | 36 |
| All food and beverage | 29 |
| Hotels and motels | 20 |
| Clothing stores | 19 |
| Real estate | 19 |
| Travel agencies | 18 |
| Corporate management | 17 |
| Boats | 15 |
| Unreachable | 15 |
| Gas station | 14 |
Procida Facts
| Area | 0.6 km² |
| Population | 2,310 |
| Male Population | 1,156 (50.0%) |
| Female Population | 1,154 (50.0%) |
| Population change (1975 to 2020) | -16.5% |
| Population change (2000 to 2020) | -5.0% |
| Median Age | 41 years (Male: 40.5, Female: 41.5) |
| Neighborhoods | Chiaia |
| Local Time | |
| Timezone | Central European Summer Time |
| Lat & Lng | 40.75636, 14.01457 |
Map of Procida
Interactive Map
Procida Population
Years 1975 to 2020
| Data | 1975 | 1990 | 2000 | 2015 | 2020 |
|---|---|---|---|---|---|
| Population | 2,766 | 2,609 | 2,431 | 2,274 | 2,310 |
| Population Density | 4,917.3 / km² | 4,638.2 / km² | 4,321.8 / km² | 4,042.7 / km² | 4,106.7 / km² |
Procida Population change from 2000 to 2015
Decrease of 6.5% from year 2000 to 2015
| Location | Change since 1975 | Change since 1990 | Change since 2000 |
|---|---|---|---|
| Procida | -17.8% | -12.8% | -6.5% |
| Italy | +8.3% | +4.9% | +4.7% |
Procida Median Age
Median Age: 41 years
| Location | Median Age | Median Age (Female) | Median Age (Male) |
|---|---|---|---|
| Procida | 41 yrs | 41.5 yrs | 40.5 yrs |
| Italy | 40.9 yrs | 41.5 yrs | 40.3 yrs |
Procida Population Density
Population Density: 4,107 / km²
| Location | Population | Area | Density |
|---|---|---|---|
| Procida | 2,310 | 0.563 km² | 4,107 / km² |
| Italy | 59.3 million | 301,510.7 km² | 197 / km² |
Procida Historical and Projected Population
Estimated Population from 1975 to 2100
- JRC (European Commission's Joint Research Centre) work on the GHS built-up grid
- CIESIN (Center for International Earth Science Information Network)
- [Link] Klein Goldewijk, K., Beusen, A., Doelman, J., and Stehfest, E.: Anthropogenic land use estimates for the Holocene – HYDE 3.2, Earth Syst. Sci. Data, 9, 927–953, https://doi.org/10.5194/essd-9-927-2017, 2017.
Price Distribution
Business distribution by price for Procida
Human Development Index (HDI)
Statistic composite index of life expectancy, education, and per capita income.
Italy CO2 Emissions
Carbon Dioxide (CO2) Emissions Per Capita in Tonnes Per Year
| Location | CO2 Emissions | CO2 Emissions Per Capita | CO2 Emissions Intensity |
|---|---|---|---|
| Italy | 399,008,505 tn | 6.73 tn | 1,323.4 tons/km² |
| 2013 CO2 emissions (tonnes/year) | 399,008,505 tn |
| 2013 CO2 emissions (tonnes/year) per capita | 6.73 tn |
| 2013 CO2 emissions intensity (tonnes/km²/year) | 1,323.4 tons/km² |
Natural Hazards Risk
Relative risk out of 10
| Hazard | Risk Level |
|---|---|
| Earthquake | Medium (4) |
| Volcano | High (10) |
* Risk, particularly concerning flood or landslide, may not be for the entire area.
- Dilley, M., R.S. Chen, U. Deichmann, A.L. Lerner-Lam, M. Arnold, J. Agwe, P. Buys, O. Kjekstad, B. Lyon, and G. Yetman. 2005. Natural Disaster Hotspots: A Global Risk Analysis. Washington, D.C.: World Bank. https://doi.org/10.1596/0-8213-5930-4.
- Center for Hazards and Risk Research - CHRR - Columbia University, Center for International Earth Science Information Network - CIESIN - Columbia University. 2005. Global Volcano Hazard Frequency and Distribution. Palisades, NY: NASA Socioeconomic Data and Applications Center (SEDAC). https://doi.org/10.7927/H4BR8Q45.
- Center for Hazards and Risk Research - CHRR - Columbia University, Center for International Earth Science Information Network - CIESIN - Columbia University. 2005. Global Earthquake Hazard Distribution - Peak Ground Acceleration. Palisades, NY: NASA Socioeconomic Data and Applications Center (SEDAC). https://doi.org/10.7927/H4BZ63ZS.
Recent Nearby Earthquakes
Magnitude 3.0 and greater
| Date▼ | Time↕ | Magnitude↕ | Distance↕ | Depth↕ | Location↕ | Link |
|---|---|---|---|---|---|---|
| 11/22/18 | 7:35 AM | 4 | 43.8 km | 386,040 m | 28km SW of Anacapri, Italy | usgs.gov |
| 11/1/17 | 11:12 PM | 4.1 | 66.8 km | 438,230 m | 55km SW of Forio, Italy | usgs.gov |
| 8/21/17 | 6:57 PM | 4.2 | 7 km | 2,650 m | 4km NNE of Casamicciola Terme, Italy | usgs.gov |
| 1/1/15 | 7:48 PM | 4.2 | 87.7 km | 318,140 m | 2km WNW of Roccamandolfi, Italy | usgs.gov |
| 1/20/14 | 7:12 AM | 4.5 | 76.5 km | 11,100 m | 5km WNW of Cusano Mutri, Italy | usgs.gov |
| 12/29/13 | 5:08 PM | 5.1 | 77.1 km | 10,500 m | 5km NE of San Potito Sannitico, Italy | usgs.gov |
| 9/27/12 | 1:08 AM | 4.6 | 91.2 km | 6,300 m | southern Italy | usgs.gov |
| 7/12/12 | 9:23 PM | 4 | 39.3 km | 423,000 m | Tyrrhenian Sea | usgs.gov |
| 5/30/08 | 5:22 PM | 4.4 | 76.4 km | 309,200 m | southern Italy | usgs.gov |
| 2/20/08 | 8:06 AM | 4.6 | 93.8 km | 8,500 m | southern Italy | usgs.gov |
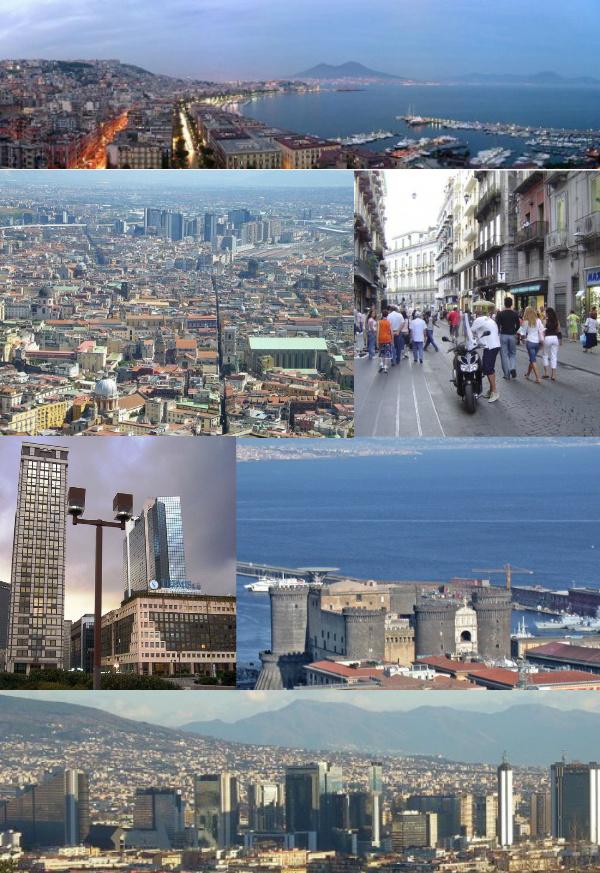
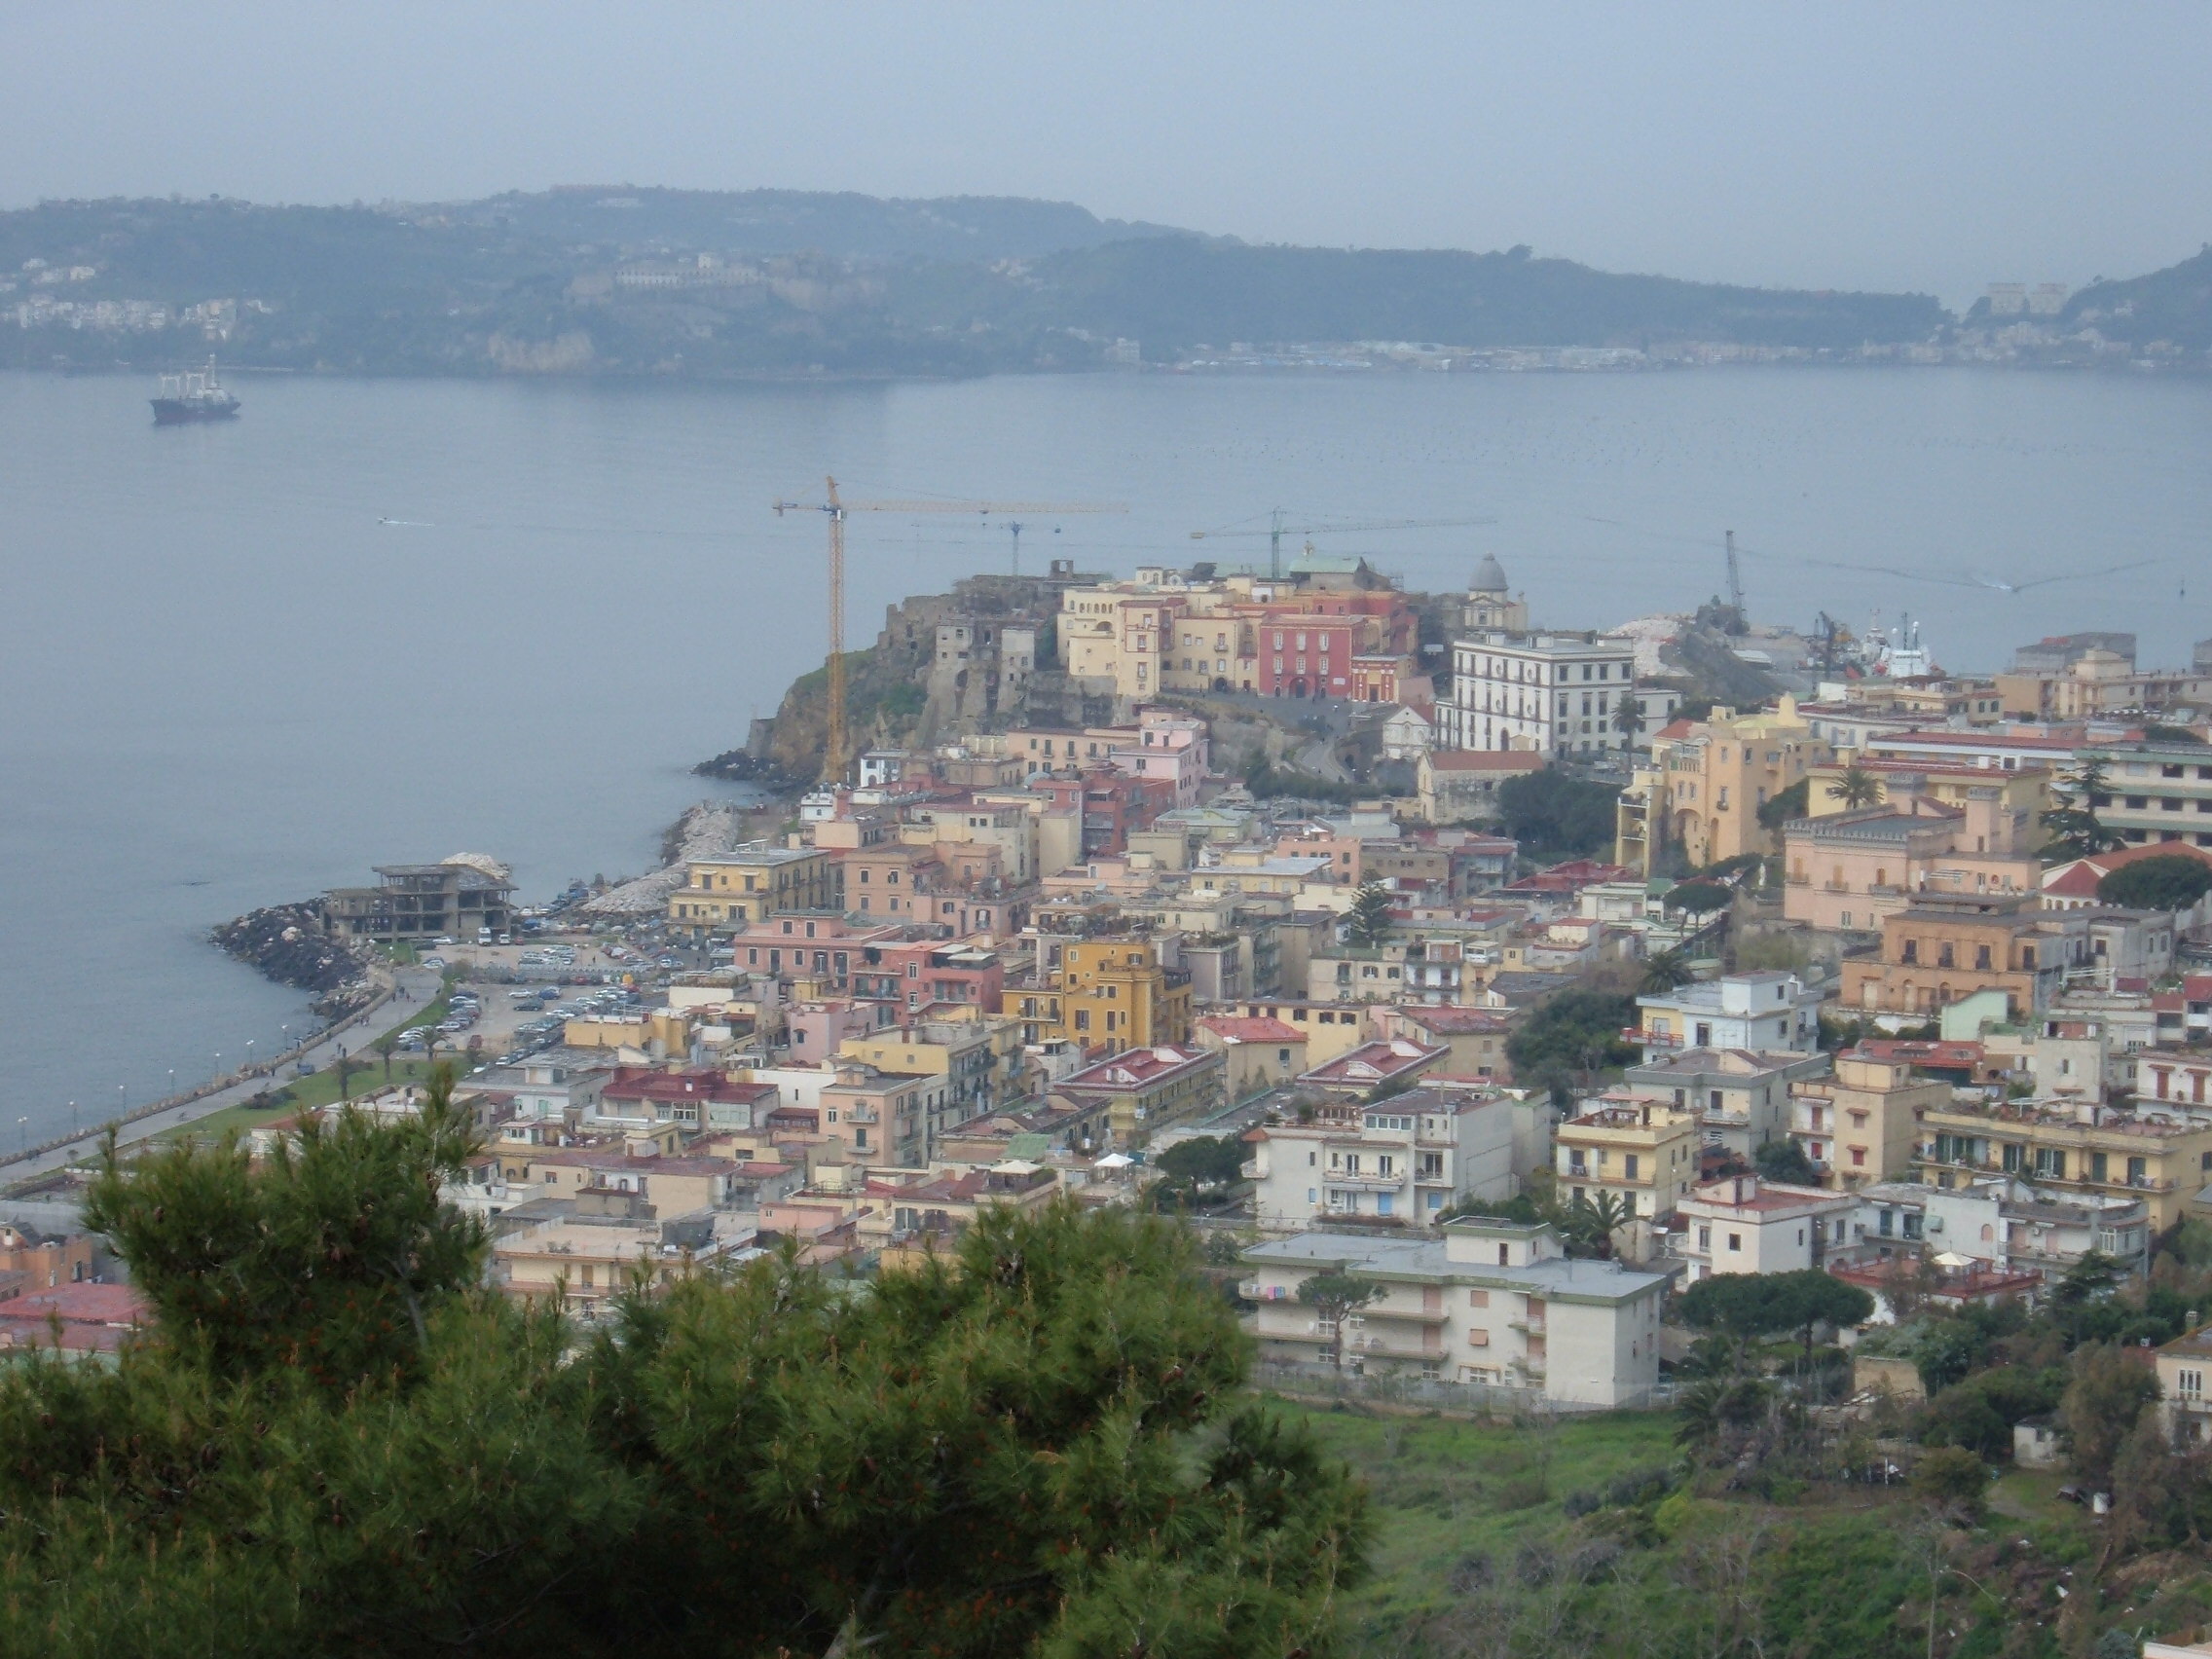
Procida
Procida (Italian pronunciation: [ˈprɔːtʃida]) is one of the Flegrean Islands off the coast of Naples in southern Italy. The island is between Cape Miseno and the island of Ischia. With its tiny satellite island of Vivara, it is a comune of the Metrop..
Procida Wikipedia Page

About Our Data
The data on this page is estimated using a number of publicly available tools and resources. It is provided without warranty, and could contain inaccuracies. Use at your own risk.