Categories in Ravello
Industries
Business Distribution by Industry in Ravello
| Industry Description | Number of Establishments | Average Google Rating |
|---|---|---|
| Other accommodation | 72 | 4.6 |
| Shopping | 44 | 4.1 |
| Hotels and motels | 38 | 4.6 |
| Restaurants | 29 | 4.3 |
| Bed and breakfasts | 27 | 4.4 |
| Bars, pubs and taverns | 23 | 4 |
| Italian restaurants | 18 | 4.3 |
| All food and beverage | 16 | 3.9 |
| Grocery stores and supermarkets | 15 | 4 |
| Travel agencies | 13 | 4.6 |
| Churches | 12 | 4.5 |
| Religion | 11 | 4.5 |
| Shopping other | 8 | 4.4 |
| Pizza | 7 | 4.2 |
| Cafes | 7 | 3.6 |
| Clothing stores | 7 | — |
| Creative arts | 5 | 4.7 |
| Concert halls and theaters | 5 | 4.1 |
| Art galleries | 5 | 4.8 |
Ravello Facts
| Area | 1.3 km² |
| Population | 375 |
| Male Population | 186 (49.6%) |
| Female Population | 189 (50.4%) |
| Population change (1975 to 2020) | -7.9% |
| Population change (2000 to 2020) | -1.8% |
| Median Age | 43 years (Male: 41.7, Female: 44.2) |
| Neighborhoods | Ponte |
| Local Time | |
| Timezone | Central European Summer Time |
| Lat & Lng | 40.64932, 14.61167 |
Map of Ravello
Interactive Map
Ravello Population
Years 1975 to 2020
| Data | 1975 | 1990 | 2000 | 2015 | 2020 |
|---|---|---|---|---|---|
| Population | 407 | 393 | 382 | 368 | 375 |
| Population Density | 310.1 / km² | 299.4 / km² | 291 / km² | 280.4 / km² | 285.7 / km² |
Ravello Population change from 2000 to 2015
Decrease of 3.7% from year 2000 to 2015
| Location | Change since 1975 | Change since 1990 | Change since 2000 |
|---|---|---|---|
| Ravello | -9.6% | -6.4% | -3.7% |
| Italy | +8.3% | +4.9% | +4.7% |
Ravello Median Age
Median Age: 43 years
| Location | Median Age | Median Age (Female) | Median Age (Male) |
|---|---|---|---|
| Ravello | 43 yrs | 44.2 yrs | 41.7 yrs |
| Italy | 40.9 yrs | 41.5 yrs | 40.3 yrs |
Ravello Population Density
Population Density: 286 / km²
| Location | Population | Area | Density |
|---|---|---|---|
| Ravello | 375 | 1.313 km² | 286 / km² |
| Italy | 59.3 million | 301,510.7 km² | 197 / km² |
Ravello Historical and Projected Population
Estimated Population from 0 to 2100
- JRC (European Commission's Joint Research Centre) work on the GHS built-up grid
- CIESIN (Center for International Earth Science Information Network)
- [Link] Klein Goldewijk, K., Beusen, A., Doelman, J., and Stehfest, E.: Anthropogenic land use estimates for the Holocene – HYDE 3.2, Earth Syst. Sci. Data, 9, 927–953, https://doi.org/10.5194/essd-9-927-2017, 2017.
Area Codes
Percentage Area Codes used by businesses in Ravello
Price Distribution
Business distribution by price for Ravello
Human Development Index (HDI)
Statistic composite index of life expectancy, education, and per capita income.
Ravello CO2 Emissions
Carbon Dioxide (CO2) Emissions Per Capita in Tonnes Per Year
| Location | CO2 Emissions | CO2 Emissions Per Capita | CO2 Emissions Intensity |
|---|---|---|---|
| Ravello | 1,751 tn | 4.67 tn | 1,333.8 tons/km² |
| Italy | 399,008,505 tn | 6.73 tn | 1,323.4 tons/km² |
| 2013 CO2 emissions (tonnes/year) | 1,751 tn |
| 2013 CO2 emissions (tonnes/year) per capita | 4.67 tn |
| 2013 CO2 emissions intensity (tonnes/km²/year) | 1,333.8 tons/km² |
Natural Hazards Risk
Relative risk out of 10
| Hazard | Risk Level |
|---|---|
| Earthquake | Low (2) |
| Landslide | Medium (6) |
* Risk, particularly concerning flood or landslide, may not be for the entire area.
- Dilley, M., R.S. Chen, U. Deichmann, A.L. Lerner-Lam, M. Arnold, J. Agwe, P. Buys, O. Kjekstad, B. Lyon, and G. Yetman. 2005. Natural Disaster Hotspots: A Global Risk Analysis. Washington, D.C.: World Bank. https://doi.org/10.1596/0-8213-5930-4.
- Center for Hazards and Risk Research - CHRR - Columbia University, Center for International Earth Science Information Network - CIESIN - Columbia University, and Norwegian Geotechnical Institute - NGI. 2005. Global Landslide Hazard Distribution. Palisades, NY: NASA Socioeconomic Data and Applications Center (SEDAC). https://doi.org/10.7927/H4P848VZ.
- Center for Hazards and Risk Research - CHRR - Columbia University, Center for International Earth Science Information Network - CIESIN - Columbia University. 2005. Global Earthquake Hazard Distribution - Peak Ground Acceleration. Palisades, NY: NASA Socioeconomic Data and Applications Center (SEDAC). https://doi.org/10.7927/H4BZ63ZS.
Recent Nearby Earthquakes
Magnitude 3.0 and greater
| Date▼ | Time↕ | Magnitude↕ | Distance↕ | Depth↕ | Location↕ | Link |
|---|---|---|---|---|---|---|
| 11/22/18 | 7:35 AM | 4 | 61.7 km | 386,040 m | 28km SW of Anacapri, Italy | usgs.gov |
| 8/21/17 | 6:57 PM | 4.2 | 58.7 km | 2,650 m | 4km NNE of Casamicciola Terme, Italy | usgs.gov |
| 12/14/14 | 2:33 PM | 4.2 | 40 km | 299,600 m | 6km NW of Capaccio, Italy | usgs.gov |
| 1/22/14 | 10:44 PM | 4 | 47.5 km | 2,000 m | 3km NE of Capaccio, Italy | usgs.gov |
| 1/20/14 | 7:12 AM | 4.5 | 80.3 km | 11,100 m | 5km WNW of Cusano Mutri, Italy | usgs.gov |
| 12/29/13 | 5:08 PM | 5.1 | 81.1 km | 10,500 m | 5km NE of San Potito Sannitico, Italy | usgs.gov |
| 9/27/12 | 1:08 AM | 4.6 | 64.5 km | 6,300 m | southern Italy | usgs.gov |
| 11/4/11 | 11:22 AM | 4.5 | 79.1 km | 326,600 m | Tyrrhenian Sea | usgs.gov |
| 5/30/08 | 5:22 PM | 4.4 | 24.7 km | 309,200 m | southern Italy | usgs.gov |
| 2/20/08 | 11:26 PM | 3.8 | 75.8 km | 326,100 m | southern Italy | usgs.gov |
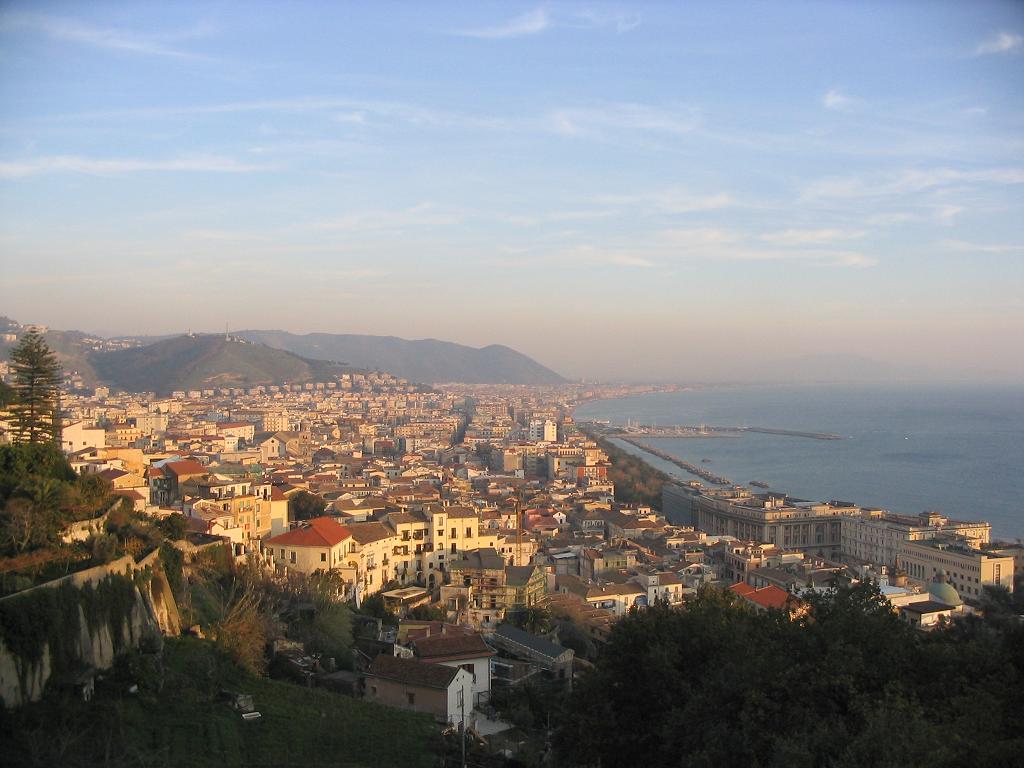
Ravello
Ravello is a town and comune situated above the Amalfi Coast in the province of Salerno, Campania, southern Italy, with approximately 2,500 inhabitants. Its scenic beauty makes it a popular tourist destination, and earned it a listing as a UNESCO Wor..
Ravello Wikipedia Page

About Our Data
The data on this page is estimated using a number of publicly available tools and resources. It is provided without warranty, and could contain inaccuracies. Use at your own risk.