Industries
Business Distribution by Industry in Salcito
| Industry Description | Number of Establishments | Average Google Rating |
|---|---|---|
| Shopping | 6 | 4.9 |
| All food and beverage | 5 | 4.7 |
Salcito Facts
| Area | 30.6 km² |
| Population | 694 |
| Male Population | 371 (53.4%) |
| Female Population | 323 (46.6%) |
| Population change (1975 to 2020) | +34.2% |
| Population change (2000 to 2020) | +14.7% |
| Median Age | 41.7 years (Male: 41.5, Female: 41.9) |
| Local Time | |
| Timezone | Central European Summer Time |
| Lat & Lng | 41.74640, 14.51085 |
| Postal Codes | 86026 |
Map of Salcito
Interactive Map
Salcito Population
Years 1975 to 2020
| Data | 1975 | 1990 | 2000 | 2015 | 2020 |
|---|---|---|---|---|---|
| Population | 517 | 567 | 605 | 703 | 694 |
| Population Density | 16.9 / km² | 18.6 / km² | 19.8 / km² | 23 / km² | 22.7 / km² |
Salcito Population change from 2000 to 2015
Increase of 16.2% from year 2000 to 2015
| Location | Change since 1975 | Change since 1990 | Change since 2000 |
|---|---|---|---|
| Salcito | +36% | +24% | +16.2% |
| Italy | +8.3% | +4.9% | +4.7% |
Salcito Median Age
Median Age: 41.7 years
| Location | Median Age | Median Age (Female) | Median Age (Male) |
|---|---|---|---|
| Salcito | 41.7 yrs | 41.9 yrs | 41.5 yrs |
| Italy | 40.9 yrs | 41.5 yrs | 40.3 yrs |
Salcito Population Density
Population Density: 22.7 / km²
| Location | Population | Area | Density |
|---|---|---|---|
| Salcito | 694 | 30.6 km² | 22.7 / km² |
| Italy | 59.3 million | 301,510.7 km² | 197 / km² |
Salcito Historical and Projected Population
Estimated Population from 0 to 2100
- JRC (European Commission's Joint Research Centre) work on the GHS built-up grid
- CIESIN (Center for International Earth Science Information Network)
- [Link] Klein Goldewijk, K., Beusen, A., Doelman, J., and Stehfest, E.: Anthropogenic land use estimates for the Holocene – HYDE 3.2, Earth Syst. Sci. Data, 9, 927–953, https://doi.org/10.5194/essd-9-927-2017, 2017.
Human Development Index (HDI)
Statistic composite index of life expectancy, education, and per capita income.
Salcito CO2 Emissions
Carbon Dioxide (CO2) Emissions Per Capita in Tonnes Per Year
| Location | CO2 Emissions | CO2 Emissions Per Capita | CO2 Emissions Intensity |
|---|---|---|---|
| Salcito | 4,555 tn | 6.56 tn | 149 tons/km² |
| Italy | 399,008,505 tn | 6.73 tn | 1,323.4 tons/km² |
| 2013 CO2 emissions (tonnes/year) | 4,555 tn |
| 2013 CO2 emissions (tonnes/year) per capita | 6.56 tn |
| 2013 CO2 emissions intensity (tonnes/km²/year) | 149 tons/km² |
Natural Hazards Risk
Relative risk out of 10
| Hazard | Risk Level |
|---|---|
| Flood | Medium (4) |
| Earthquake | Medium (6) |
| Landslide | Medium (6) |
* Risk, particularly concerning flood or landslide, may not be for the entire area.
- Dilley, M., R.S. Chen, U. Deichmann, A.L. Lerner-Lam, M. Arnold, J. Agwe, P. Buys, O. Kjekstad, B. Lyon, and G. Yetman. 2005. Natural Disaster Hotspots: A Global Risk Analysis. Washington, D.C.: World Bank. https://doi.org/10.1596/0-8213-5930-4.
- Center for Hazards and Risk Research - CHRR - Columbia University, Center for International Earth Science Information Network - CIESIN - Columbia University, and Norwegian Geotechnical Institute - NGI. 2005. Global Landslide Hazard Distribution. Palisades, NY: NASA Socioeconomic Data and Applications Center (SEDAC). https://doi.org/10.7927/H4P848VZ.
- Center for Hazards and Risk Research - CHRR - Columbia University, Center for International Earth Science Information Network - CIESIN - Columbia University. 2005. Global Flood Hazard Frequency and Distribution. Palisades, NY: NASA Socioeconomic Data and Applications Center (SEDAC). https://doi.org/10.7927/H4668B3D.
- Center for Hazards and Risk Research - CHRR - Columbia University, Center for International Earth Science Information Network - CIESIN - Columbia University. 2005. Global Earthquake Hazard Distribution - Peak Ground Acceleration. Palisades, NY: NASA Socioeconomic Data and Applications Center (SEDAC). https://doi.org/10.7927/H4BZ63ZS.
Recent Nearby Earthquakes
Magnitude 3.0 and greater
| Date▼ | Time↕ | Magnitude↕ | Distance↕ | Depth↕ | Location↕ | Link |
|---|---|---|---|---|---|---|
| 8/16/18 | 8:22 PM | 4.5 | 24.6 km | 3,240 m | 3km NNW of Guardialfiera, Italy | usgs.gov |
| 8/16/18 | 6:19 PM | 5.3 | 28.6 km | 11,590 m | 2km SE of Palata, Italy | usgs.gov |
| 8/14/18 | 9:48 PM | 4.6 | 28.5 km | 10,000 m | 1km SE of Palata, Italy | usgs.gov |
| 4/25/18 | 9:48 AM | 4.3 | 30.7 km | 10,000 m | 1km W of Montecilfone, Italy | usgs.gov |
| 1/16/16 | 6:55 PM | 4.4 | 21.5 km | 5,400 m | 3km NNW of Campobasso, Italy | usgs.gov |
| 1/1/15 | 7:48 PM | 4.2 | 30.4 km | 318,140 m | 2km WNW of Roccamandolfi, Italy | usgs.gov |
| 12/24/14 | 11:40 AM | 4.4 | 37.5 km | 17,600 m | 1km NNW of San Giuliano di Puglia, Italy | usgs.gov |
| 1/20/14 | 7:12 AM | 4.5 | 43 km | 11,100 m | 5km WNW of Cusano Mutri, Italy | usgs.gov |
| 12/29/13 | 5:08 PM | 5.1 | 42.3 km | 10,500 m | 5km NE of San Potito Sannitico, Italy | usgs.gov |
| 10/18/07 | 11:25 PM | 4 | 16.6 km | 10,000 m | southern Italy | usgs.gov |
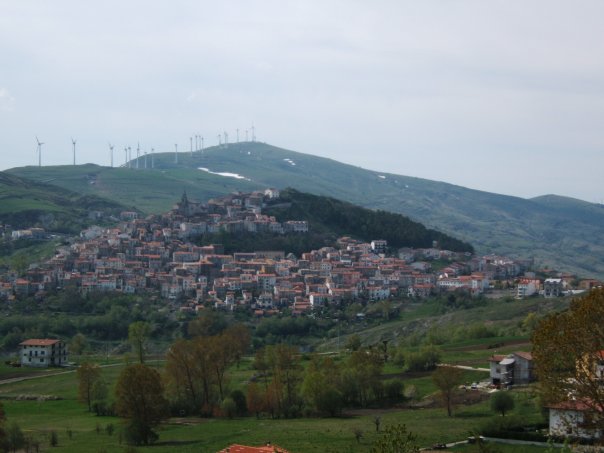
Salcito
Salcito is a comune (municipality) in the Province of Campobasso in the Italian region Molise, located about 25 kilometres (16 mi) northwest of Campobasso. As of 31 December 2004, it had a population of 690 and an area of 28.2 square kilometres (10.9..
Salcito Wikipedia Page

About Our Data
The data on this page is estimated using a number of publicly available tools and resources. It is provided without warranty, and could contain inaccuracies. Use at your own risk.