Categories in Secondigliano
Car repairParking lots and garagesWholesale of construction suppliesClothing storesPost officeElectronics storesConstruction of buildingsElectrical installationOther constructionEducationAll food and beverageBars, pubs and tavernsButcherCafesGrocery stores and supermarketsRestaurantsFurniture storesHousehold appliances and goodsRepair otherLawyers legalHospitalsBeauty salonsTrade unionsShoppingShopping otherAirportsBuses and trains
Secondigliano Facts
| Area | 2.9 km² |
| Population | 38,992 |
| Male Population | 19,276 (49.4%) |
| Female Population | 19,716 (50.6%) |
| Population change (1975 to 2020) | -19.6% |
| Population change (2000 to 2020) | -6.2% |
| Median Age | 36.9 years (Male: 35.7, Female: 38.1) |
| Neighborhoods | Secondigliano |
| Local Time | |
| Timezone | Central European Summer Time |
| Lat & Lng | 40.90000, 14.26667 |
| Postal Codes | 80144 |
Map of Secondigliano
Interactive Map
Secondigliano Population
Years 1975 to 2020
| Data | 1975 | 1990 | 2000 | 2015 | 2020 |
|---|---|---|---|---|---|
| Population | 48,485 | 44,907 | 41,569 | 38,042 | 38,992 |
| Population Density | 16,864.3 / km² | 15,619.8 / km² | 14,458.8 / km² | 13,232 / km² | 13,562.4 / km² |
Sources: JRC (European Commission's Joint Research Centre) work on the GHS built-up grid
Secondigliano Population change from 2000 to 2015
Decrease of 8.5% from year 2000 to 2015
| Location | Change since 1975 | Change since 1990 | Change since 2000 |
|---|---|---|---|
| Secondigliano | -21.5% | -15.3% | -8.5% |
| Italy | +8.3% | +4.9% | +4.7% |
Sources: JRC (European Commission's Joint Research Centre) work on the GHS built-up grid
Secondigliano Median Age
Median Age: 36.9 years
| Location | Median Age | Median Age (Female) | Median Age (Male) |
|---|---|---|---|
| Secondigliano | 36.9 yrs | 38.1 yrs | 35.7 yrs |
| Italy | 40.9 yrs | 41.5 yrs | 40.3 yrs |
Sources: CIESIN (Center for International Earth Science Information Network)
Secondigliano Population Density
Population Density: 13,562 / km²
| Location | Population | Area | Density |
|---|---|---|---|
| Secondigliano | 38,992 | 2.875 km² | 13,562 / km² |
| Italy | 59.3 million | 301,510.7 km² | 197 / km² |
Sources: JRC (European Commission's Joint Research Centre) work on the GHS built-up grid
Secondigliano Historical and Projected Population
Estimated Population from 0 to 2100
Sources:
- JRC (European Commission's Joint Research Centre) work on the GHS built-up grid
- CIESIN (Center for International Earth Science Information Network)
- [Link] Klein Goldewijk, K., Beusen, A., Doelman, J., and Stehfest, E.: Anthropogenic land use estimates for the Holocene – HYDE 3.2, Earth Syst. Sci. Data, 9, 927–953, https://doi.org/10.5194/essd-9-927-2017, 2017.
Human Development Index (HDI)
Statistic composite index of life expectancy, education, and per capita income.
Source: [Link] Kummu, M., Taka, M. &Guillaume, J. Gridded global datasets for Gross Domestic Product and Human Development Index over 1990–2015. Sci Data 5, 180004 (2018) doi:10.1038/sdata.2018.4
Secondigliano CO2 Emissions
Carbon Dioxide (CO2) Emissions Per Capita in Tonnes Per Year
| Location | CO2 Emissions | CO2 Emissions Per Capita | CO2 Emissions Intensity |
|---|---|---|---|
| Secondigliano | 179,880 tn | 4.61 tn | 62,567.1 tons/km² |
| Italy | 399,008,505 tn | 6.73 tn | 1,323.4 tons/km² |
Sources: [Link] Moran, D., Kanemoto K; Jiborn, M., Wood, R., Többen, J., and Seto, K.C. (2018) Carbon footprints of 13,000 cities. Environmental Research Letters DOI: 10.1088/1748-9326/aac72a
Secondigliano CO2 Emissions
| 2013 CO2 emissions (tonnes/year) | 179,880 tn |
| 2013 CO2 emissions (tonnes/year) per capita | 4.61 tn |
| 2013 CO2 emissions intensity (tonnes/km²/year) | 62,567.1 tons/km² |
Natural Hazards Risk
Relative risk out of 10
| Hazard | Risk Level |
|---|---|
| Earthquake | Medium (4) |
| Volcano | High (10) |
* Risk, particularly concerning flood or landslide, may not be for the entire area.
Sources:
- Dilley, M., R.S. Chen, U. Deichmann, A.L. Lerner-Lam, M. Arnold, J. Agwe, P. Buys, O. Kjekstad, B. Lyon, and G. Yetman. 2005. Natural Disaster Hotspots: A Global Risk Analysis. Washington, D.C.: World Bank. https://doi.org/10.1596/0-8213-5930-4.
- Center for Hazards and Risk Research - CHRR - Columbia University, Center for International Earth Science Information Network - CIESIN - Columbia University. 2005. Global Volcano Hazard Frequency and Distribution. Palisades, NY: NASA Socioeconomic Data and Applications Center (SEDAC). https://doi.org/10.7927/H4BR8Q45.
- Center for Hazards and Risk Research - CHRR - Columbia University, Center for International Earth Science Information Network - CIESIN - Columbia University. 2005. Global Earthquake Hazard Distribution - Peak Ground Acceleration. Palisades, NY: NASA Socioeconomic Data and Applications Center (SEDAC). https://doi.org/10.7927/H4BZ63ZS.
Recent Nearby Earthquakes
Magnitude 3.0 and greater
| Date▼ | Time↕ | Magnitude↕ | Distance↕ | Depth↕ | Location↕ | Link |
|---|---|---|---|---|---|---|
| 11/22/18 | 7:35 AM | 4 | 64.2 km | 386,040 m | 28km SW of Anacapri, Italy | usgs.gov |
| 8/21/17 | 6:57 PM | 4.2 | 30.5 km | 2,650 m | 4km NNE of Casamicciola Terme, Italy | usgs.gov |
| 1/16/16 | 6:55 PM | 4.4 | 82.6 km | 5,400 m | 3km NNW of Campobasso, Italy | usgs.gov |
| 1/1/15 | 7:48 PM | 4.2 | 68 km | 318,140 m | 2km WNW of Roccamandolfi, Italy | usgs.gov |
| 12/14/14 | 2:33 PM | 4.2 | 79.8 km | 299,600 m | 6km NW of Capaccio, Italy | usgs.gov |
| 1/20/14 | 7:12 AM | 4.5 | 53.5 km | 11,100 m | 5km WNW of Cusano Mutri, Italy | usgs.gov |
| 12/29/13 | 5:08 PM | 5.1 | 54.2 km | 10,500 m | 5km NE of San Potito Sannitico, Italy | usgs.gov |
| 9/27/12 | 1:08 AM | 4.6 | 64.8 km | 6,300 m | southern Italy | usgs.gov |
| 7/12/12 | 9:23 PM | 4 | 65.6 km | 423,000 m | Tyrrhenian Sea | usgs.gov |
| 5/30/08 | 5:22 PM | 4.4 | 63.9 km | 309,200 m | southern Italy | usgs.gov |
Source: U.S. Geological Survey (USGS)
Secondigliano
Secondigliano is a relatively modern suburb in the north of Naples, in southern Italy.
Secondigliano Wikipedia Page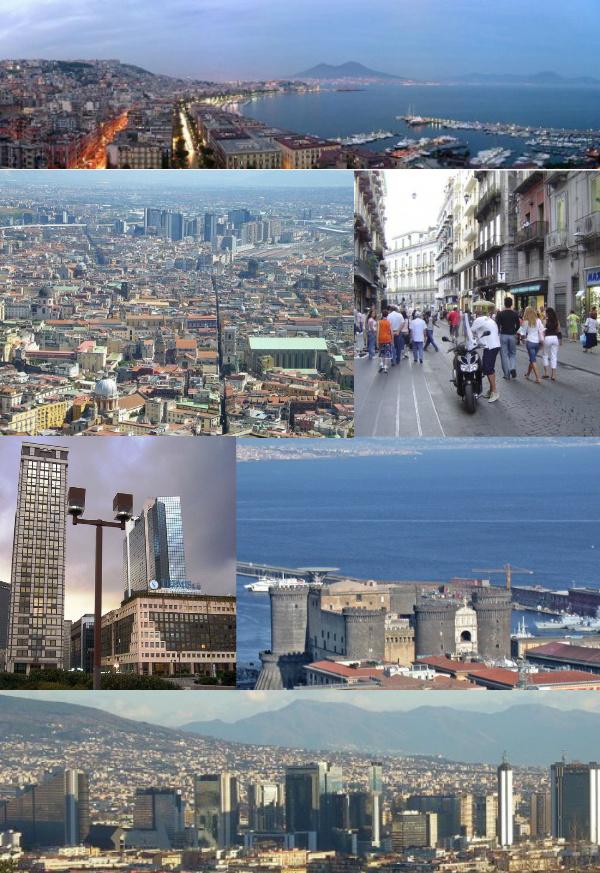


About Our Data
The data on this page is estimated using a number of publicly available tools and resources. It is provided without warranty, and could contain inaccuracies. Use at your own risk.