Categories in Sirolo
Industries
Business Distribution by Industry in Sirolo
| Industry Description | Number of Establishments | Average Google Rating |
|---|---|---|
| Other accommodation | 71 | 4.4 |
| Restaurants | 47 | 4.2 |
| Bed and breakfasts | 40 | 4.5 |
| Shopping | 36 | 4.1 |
| Bars, pubs and taverns | 25 | 4.2 |
| Hotels and motels | 21 | 4.3 |
| All food and beverage | 16 | 4.2 |
| Sports and recreation | 15 | 4.4 |
| Seafood restaurants | 12 | 4.3 |
| Grocery stores and supermarkets | 9 | 3.9 |
| Italian restaurants | 9 | 4.3 |
| Construction of buildings | 8 | 4.2 |
| Car repair | 8 | 4.6 |
| Holiday homes, cabins and resorts | 7 | 4.4 |
| Beauty salons | 7 | 4.1 |
| Real estate | 7 | 3.7 |
| Campgrounds | 6 | 4 |
| Ice cream and yogurt shops | 6 | 3.7 |
| Clothing stores | 6 | 5 |
| Hairdressers | 5 | 4.4 |
| Travel agencies | 5 | 4.6 |
| Cafes | 5 | 4.3 |
Sirolo Facts
| Area | 0.7 km² |
| Population | 1,794 |
| Male Population | 874 (48.7%) |
| Female Population | 920 (51.3%) |
| Population change (1975 to 2020) | +75.7% |
| Population change (2000 to 2020) | +25.3% |
| Median Age | 43.2 years (Male: 43.3, Female: 43.1) |
| Local Time | |
| Timezone | Central European Summer Time |
| Lat & Lng | 43.52246, 13.61498 |
Map of Sirolo
Interactive Map
Sirolo Population
Years 1975 to 2020
| Data | 1975 | 1990 | 2000 | 2015 | 2020 |
|---|---|---|---|---|---|
| Population | 1,021 | 1,279 | 1,432 | 1,761 | 1,794 |
| Population Density | 1,485.1 / km² | 1,860.4 / km² | 2,082.9 / km² | 2,561.5 / km² | 2,609.5 / km² |
Sirolo Population change from 2000 to 2015
Increase of 23% from year 2000 to 2015
| Location | Change since 1975 | Change since 1990 | Change since 2000 |
|---|---|---|---|
| Sirolo | +72.5% | +37.7% | +23% |
| Italy | +8.3% | +4.9% | +4.7% |
Sirolo Median Age
Median Age: 43.2 years
| Location | Median Age | Median Age (Female) | Median Age (Male) |
|---|---|---|---|
| Sirolo | 43.2 yrs | 43.1 yrs | 43.3 yrs |
| Italy | 40.9 yrs | 41.5 yrs | 40.3 yrs |
Sirolo Population Density
Population Density: 2,610 / km²
| Location | Population | Area | Density |
|---|---|---|---|
| Sirolo | 1,794 | 0.688 km² | 2,610 / km² |
| Italy | 59.3 million | 301,510.7 km² | 197 / km² |
Sirolo Historical and Projected Population
Estimated Population from 1975 to 2100
- JRC (European Commission's Joint Research Centre) work on the GHS built-up grid
- CIESIN (Center for International Earth Science Information Network)
- [Link] Klein Goldewijk, K., Beusen, A., Doelman, J., and Stehfest, E.: Anthropogenic land use estimates for the Holocene – HYDE 3.2, Earth Syst. Sci. Data, 9, 927–953, https://doi.org/10.5194/essd-9-927-2017, 2017.
Area Codes
Percentage Area Codes used by businesses in Sirolo
Price Distribution
Business distribution by price for Sirolo
Human Development Index (HDI)
Statistic composite index of life expectancy, education, and per capita income.
Sirolo CO2 Emissions
Carbon Dioxide (CO2) Emissions Per Capita in Tonnes Per Year
| Location | CO2 Emissions | CO2 Emissions Per Capita | CO2 Emissions Intensity |
|---|---|---|---|
| Sirolo | 12,735 tn | 7.1 tn | 18,524 tons/km² |
| Italy | 399,008,505 tn | 6.73 tn | 1,323.4 tons/km² |
| 2013 CO2 emissions (tonnes/year) | 12,735 tn |
| 2013 CO2 emissions (tonnes/year) per capita | 7.1 tn |
| 2013 CO2 emissions intensity (tonnes/km²/year) | 18,524 tons/km² |
Natural Hazards Risk
Relative risk out of 10
| Hazard | Risk Level |
|---|---|
| Earthquake | Medium (5.5) |
| Landslide | Medium (6) |
* Risk, particularly concerning flood or landslide, may not be for the entire area.
- Dilley, M., R.S. Chen, U. Deichmann, A.L. Lerner-Lam, M. Arnold, J. Agwe, P. Buys, O. Kjekstad, B. Lyon, and G. Yetman. 2005. Natural Disaster Hotspots: A Global Risk Analysis. Washington, D.C.: World Bank. https://doi.org/10.1596/0-8213-5930-4.
- Center for Hazards and Risk Research - CHRR - Columbia University, Center for International Earth Science Information Network - CIESIN - Columbia University, and Norwegian Geotechnical Institute - NGI. 2005. Global Landslide Hazard Distribution. Palisades, NY: NASA Socioeconomic Data and Applications Center (SEDAC). https://doi.org/10.7927/H4P848VZ.
- Center for Hazards and Risk Research - CHRR - Columbia University, Center for International Earth Science Information Network - CIESIN - Columbia University. 2005. Global Earthquake Hazard Distribution - Peak Ground Acceleration. Palisades, NY: NASA Socioeconomic Data and Applications Center (SEDAC). https://doi.org/10.7927/H4BZ63ZS.
Recent Nearby Earthquakes
Magnitude 3.0 and greater
| Date▼ | Time↕ | Magnitude↕ | Distance↕ | Depth↕ | Location↕ | Link |
|---|---|---|---|---|---|---|
| 8/22/13 | 6:44 AM | 4.3 | 16.7 km | 7,900 m | 16km ENE of Sirolo, Italy | usgs.gov |
| 7/21/13 | 3:07 AM | 4.2 | 7.7 km | 10,000 m | 8km E of Sirolo, Italy | usgs.gov |
| 7/21/13 | 1:32 AM | 5.4 | 4.9 km | 8,400 m | 10km E of Numana, Italy | usgs.gov |
| 1/12/10 | 1:35 PM | 4.1 | 46 km | 24,100 m | central Italy | usgs.gov |
| 1/12/10 | 8:25 AM | 4.1 | 47.3 km | 25,600 m | central Italy | usgs.gov |
| 9/20/09 | 3:50 AM | 4.3 | 22.1 km | 37,700 m | central Italy | usgs.gov |
| 12/2/08 | 3:15 AM | 3.2 | 24.2 km | 10,100 m | central Italy | usgs.gov |
| 11/9/08 | 9:30 AM | 3.1 | 43.3 km | 31,600 m | central Italy | usgs.gov |
| 5/4/08 | 11:28 PM | 3.3 | 48.4 km | 3,700 m | central Italy | usgs.gov |
| 8/1/07 | 12:17 PM | 3.1 | 27 km | 3,300 m | central Italy | usgs.gov |
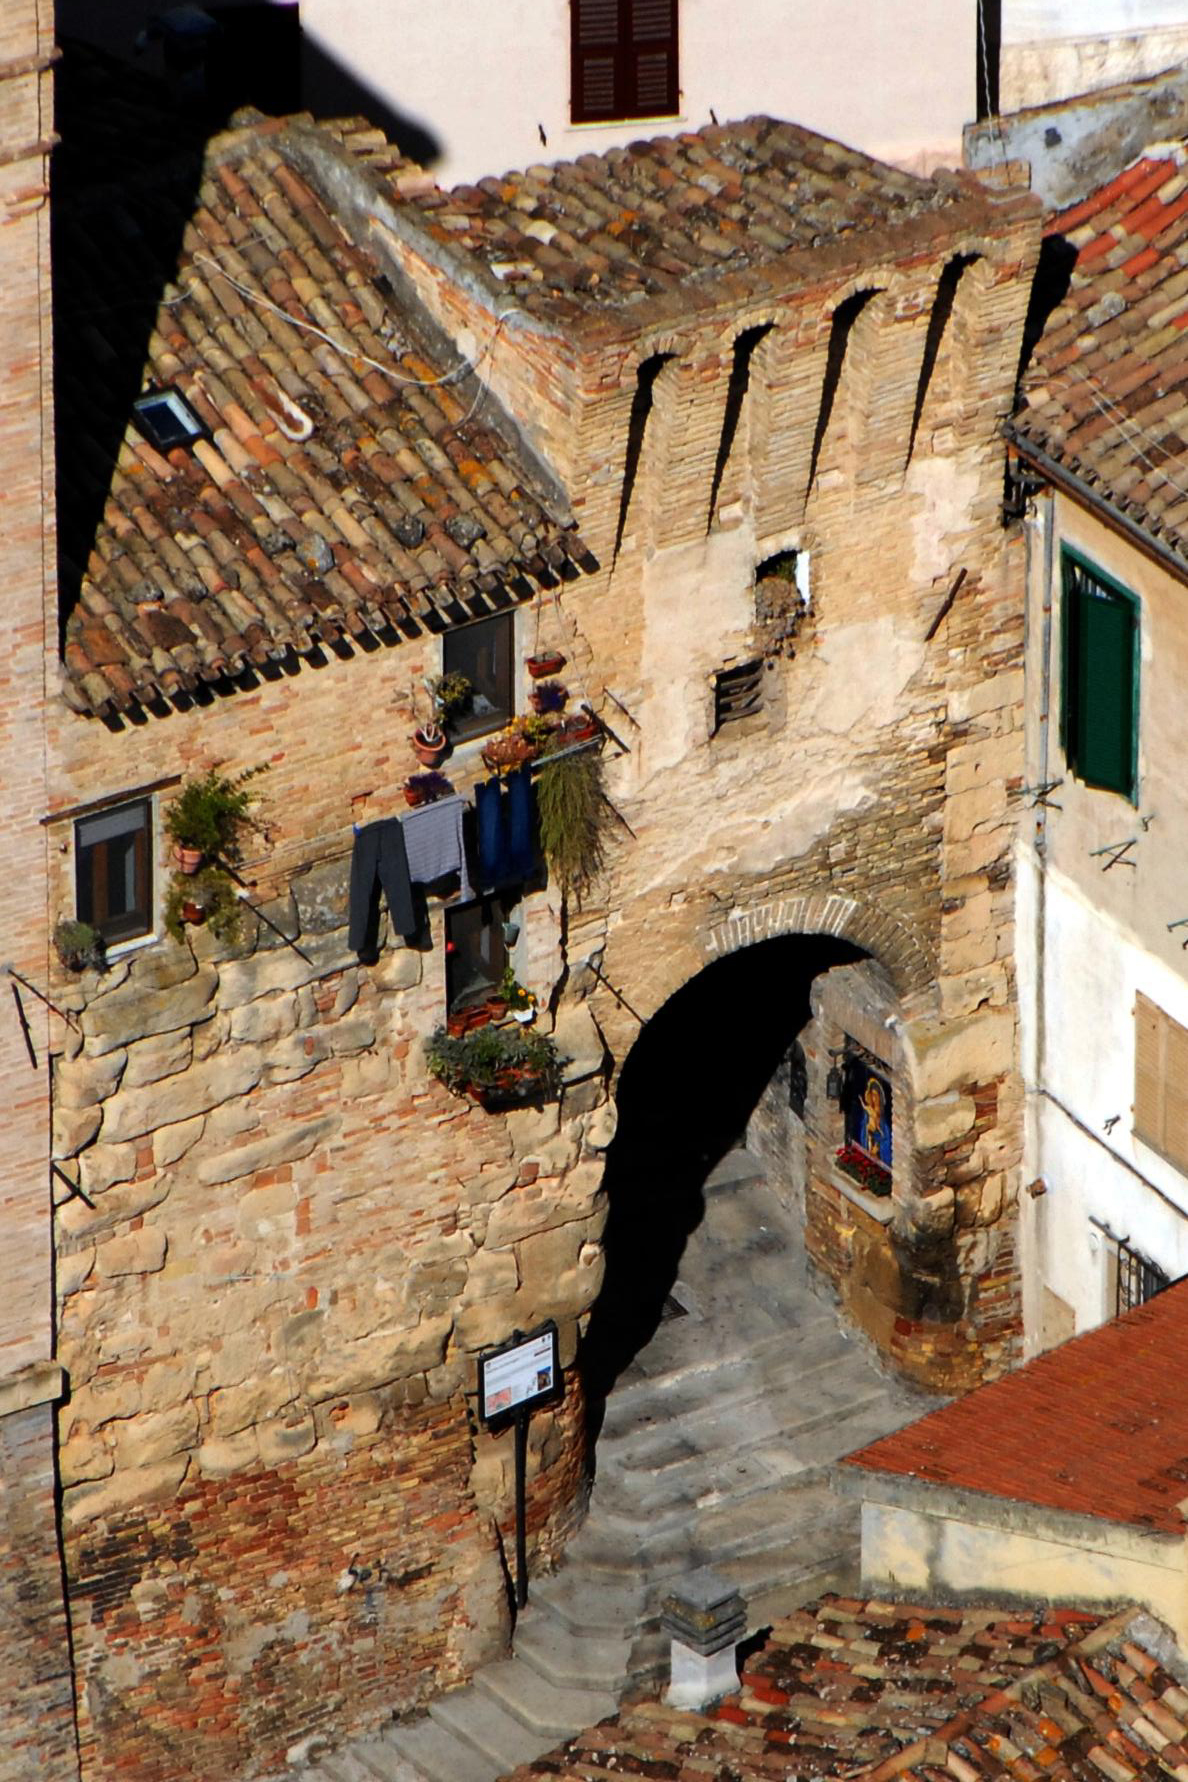
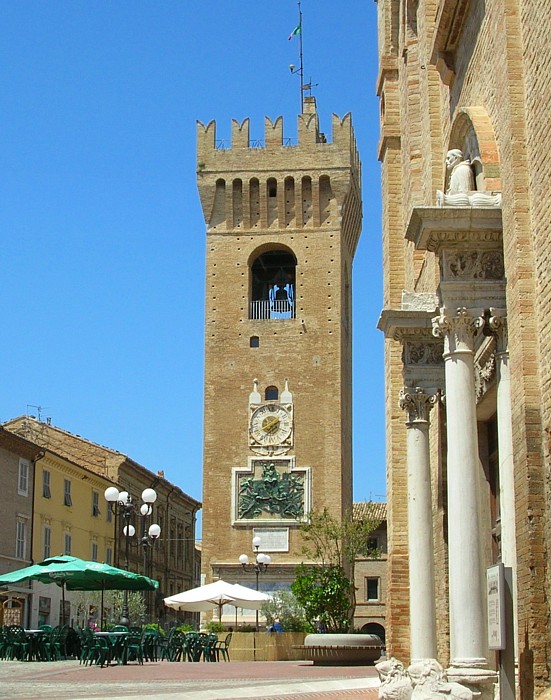
Sirolo
Sirolo is a comune (municipality) in the Province of Ancona in the Italian region of Marche. As of 28 February 2009 it had a population of 3,747 inhabitants and an area of 16.68 square kilometres (6.44 sq mi). town is situated near Monte Conero and ..
Sirolo Wikipedia Page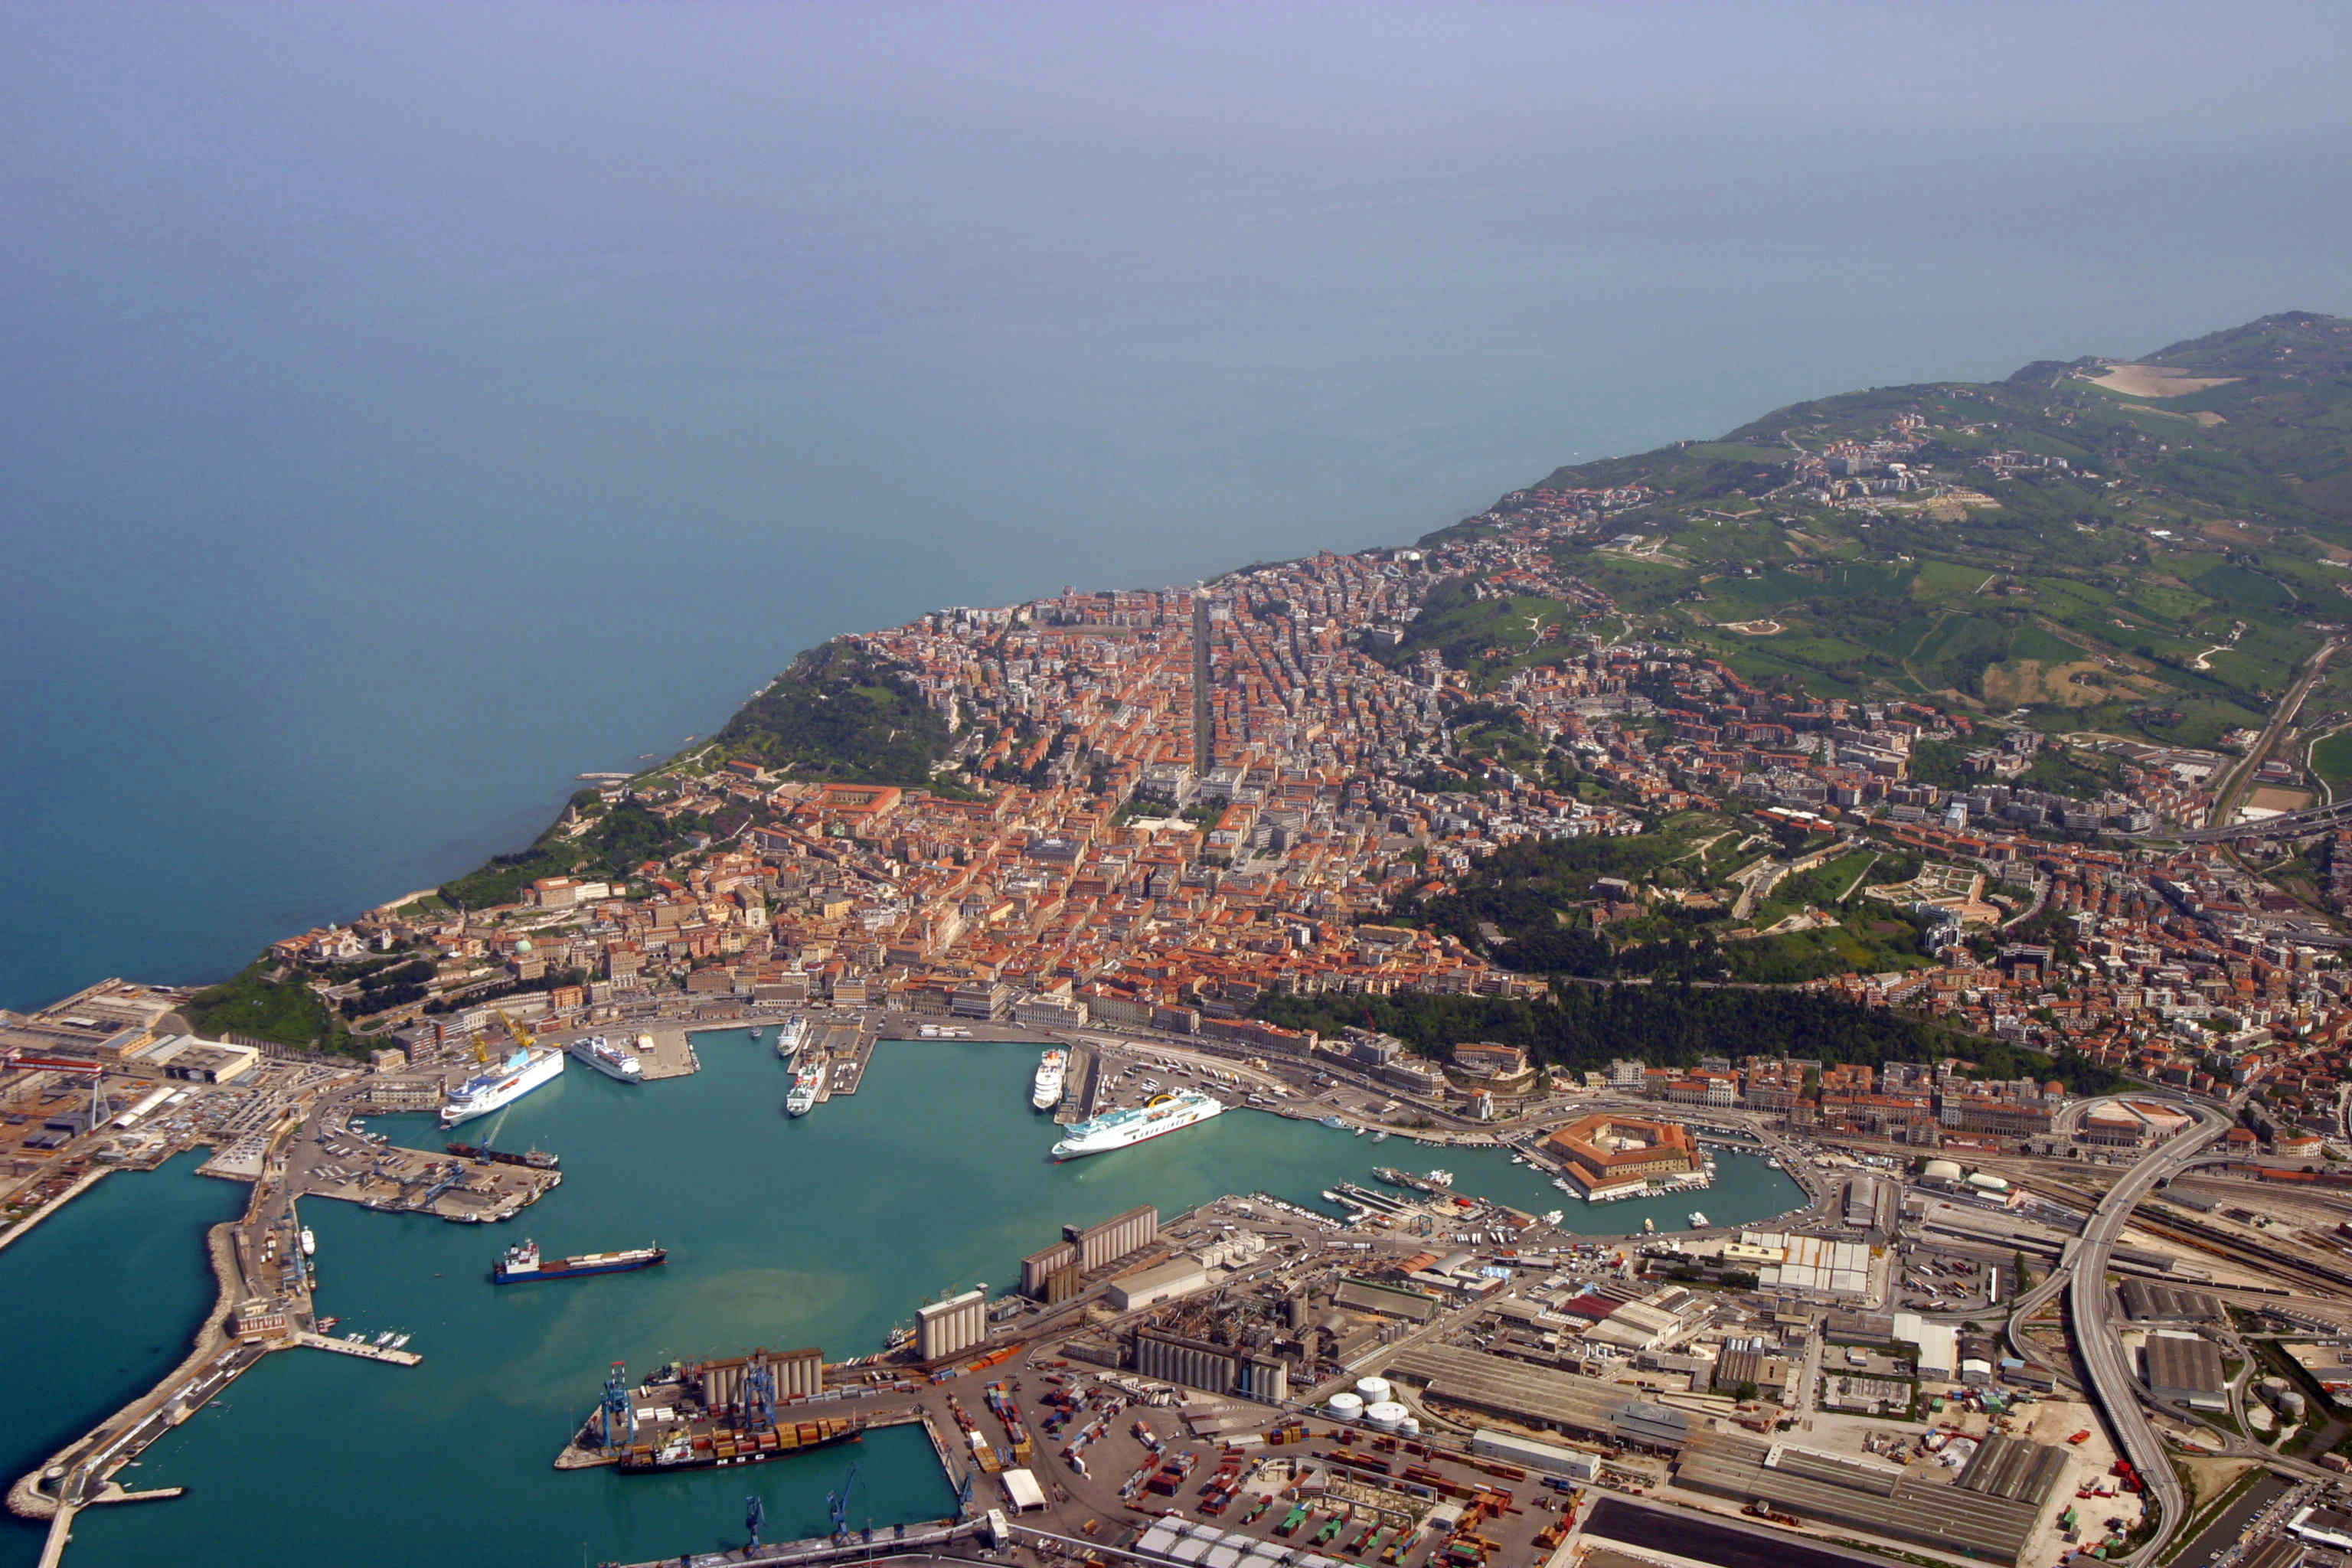
About Our Data
The data on this page is estimated using a number of publicly available tools and resources. It is provided without warranty, and could contain inaccuracies. Use at your own risk.