Categories in Sommo
Industries
Business Distribution by Industry in Sommo
| Industry Description | Number of Establishments | Average Google Rating |
|---|---|---|
| Shopping | 5 | 5 |
Sommo Facts
| Area | 2.2 km² |
| Population | 555 |
| Male Population | 292 (52.7%) |
| Female Population | 263 (47.3%) |
| Population change (1975 to 2020) | +40.9% |
| Population change (2000 to 2020) | +14.0% |
| Median Age | 42.7 years (Male: 42.1, Female: 43.4) |
| Local Time | |
| Timezone | Central European Summer Time |
| Lat & Lng | 45.13316, 9.08655 |
| Postal Codes | 27048 |
Map of Sommo
Interactive Map
Sommo Population
Years 1975 to 2020
| Data | 1975 | 1990 | 2000 | 2015 | 2020 |
|---|---|---|---|---|---|
| Population | 394 | 455 | 487 | 556 | 555 |
| Population Density | 180.1 / km² | 208 / km² | 222.6 / km² | 254.2 / km² | 253.7 / km² |
Sommo Population change from 2000 to 2015
Increase of 14.2% from year 2000 to 2015
| Location | Change since 1975 | Change since 1990 | Change since 2000 |
|---|---|---|---|
| Sommo | +41.1% | +22.2% | +14.2% |
| Italy | +8.3% | +4.9% | +4.7% |
Sommo Median Age
Median Age: 42.7 years
| Location | Median Age | Median Age (Female) | Median Age (Male) |
|---|---|---|---|
| Sommo | 42.7 yrs | 43.4 yrs | 42.1 yrs |
| Italy | 40.9 yrs | 41.5 yrs | 40.3 yrs |
Sommo Population Density
Population Density: 254 / km²
| Location | Population | Area | Density |
|---|---|---|---|
| Sommo | 555 | 2.188 km² | 254 / km² |
| Italy | 59.3 million | 301,510.7 km² | 197 / km² |
Sommo Historical and Projected Population
Estimated Population from 0 to 2100
- JRC (European Commission's Joint Research Centre) work on the GHS built-up grid
- CIESIN (Center for International Earth Science Information Network)
- [Link] Klein Goldewijk, K., Beusen, A., Doelman, J., and Stehfest, E.: Anthropogenic land use estimates for the Holocene – HYDE 3.2, Earth Syst. Sci. Data, 9, 927–953, https://doi.org/10.5194/essd-9-927-2017, 2017.
Human Development Index (HDI)
Statistic composite index of life expectancy, education, and per capita income.
Sommo CO2 Emissions
Carbon Dioxide (CO2) Emissions Per Capita in Tonnes Per Year
| Location | CO2 Emissions | CO2 Emissions Per Capita | CO2 Emissions Intensity |
|---|---|---|---|
| Sommo | 4,380 tn | 7.89 tn | 2,002.5 tons/km² |
| Italy | 399,008,505 tn | 6.73 tn | 1,323.4 tons/km² |
| 2013 CO2 emissions (tonnes/year) | 4,380 tn |
| 2013 CO2 emissions (tonnes/year) per capita | 7.89 tn |
| 2013 CO2 emissions intensity (tonnes/km²/year) | 2,002.5 tons/km² |
Natural Hazards Risk
Relative risk out of 10
| Hazard | Risk Level |
|---|---|
| Flood | High (8) |
| Earthquake | Medium (4) |
* Risk, particularly concerning flood or landslide, may not be for the entire area.
- Dilley, M., R.S. Chen, U. Deichmann, A.L. Lerner-Lam, M. Arnold, J. Agwe, P. Buys, O. Kjekstad, B. Lyon, and G. Yetman. 2005. Natural Disaster Hotspots: A Global Risk Analysis. Washington, D.C.: World Bank. https://doi.org/10.1596/0-8213-5930-4.
- Center for Hazards and Risk Research - CHRR - Columbia University, Center for International Earth Science Information Network - CIESIN - Columbia University. 2005. Global Flood Hazard Frequency and Distribution. Palisades, NY: NASA Socioeconomic Data and Applications Center (SEDAC). https://doi.org/10.7927/H4668B3D.
- Center for Hazards and Risk Research - CHRR - Columbia University, Center for International Earth Science Information Network - CIESIN - Columbia University. 2005. Global Earthquake Hazard Distribution - Peak Ground Acceleration. Palisades, NY: NASA Socioeconomic Data and Applications Center (SEDAC). https://doi.org/10.7927/H4BZ63ZS.
Recent Nearby Earthquakes
Magnitude 3.0 and greater
| Date▼ | Time↕ | Magnitude↕ | Distance↕ | Depth↕ | Location↕ | Link |
|---|---|---|---|---|---|---|
| 11/30/14 | 9:34 AM | 4 | 68.2 km | 12,000 m | 3km NNW of Santo Stefano d'Aveto, Italy | usgs.gov |
| 11/14/13 | 11:34 AM | 3.1 | 66.5 km | 10,600 m | 3km NNW of Mignanego, Italy | usgs.gov |
| 3/5/12 | 3:15 PM | 4.7 | 68.3 km | 9,200 m | northern Italy | usgs.gov |
| 10/20/11 | 6:11 AM | 4.2 | 67.7 km | 24,700 m | northern Italy | usgs.gov |
| 10/20/11 | 6:10 AM | 4.2 | 72.3 km | 10,000 m | northern Italy | usgs.gov |
| 12/5/07 | 4:34 PM | 3.2 | 37.5 km | 3,300 m | northern Italy | usgs.gov |
| 9/17/07 | 6:43 PM | 3.3 | 37.7 km | 36,000 m | northern Italy | usgs.gov |
| 7/11/07 | 8:43 AM | 3.1 | 63.9 km | 3,000 m | northern Italy | usgs.gov |
| 4/22/06 | 5:02 AM | 3.5 | 27.3 km | 10,000 m | northern Italy | usgs.gov |
| 11/20/05 | 10:48 AM | 4 | 31.6 km | 34,500 m | northern Italy | usgs.gov |
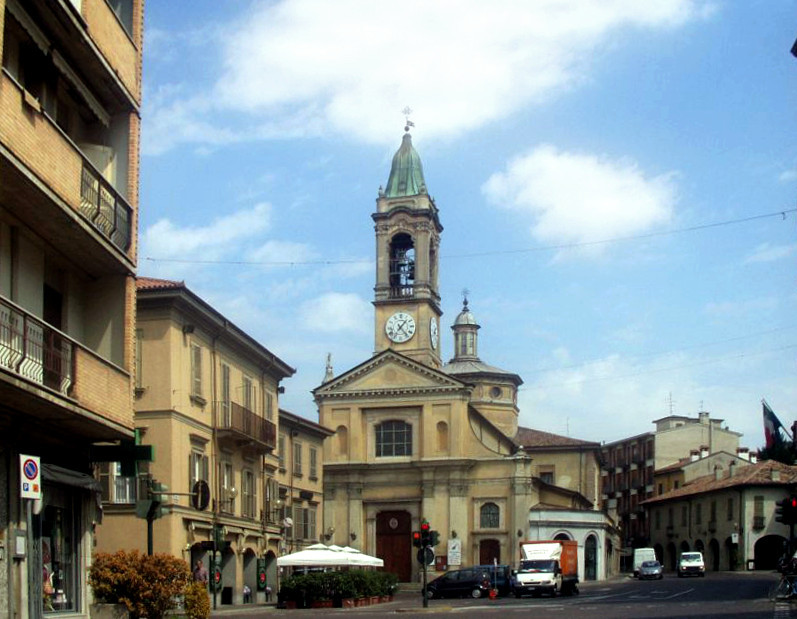
Sommo
Sommo is a comune (municipality) in the province of Pavia in the Italian region Lombardy, about 40 km south of Milan and about 8 km southwest of Pavia, on the eastern border of Lomellina traditional region. borders the following municipalities: Bast..
Sommo Wikipedia Page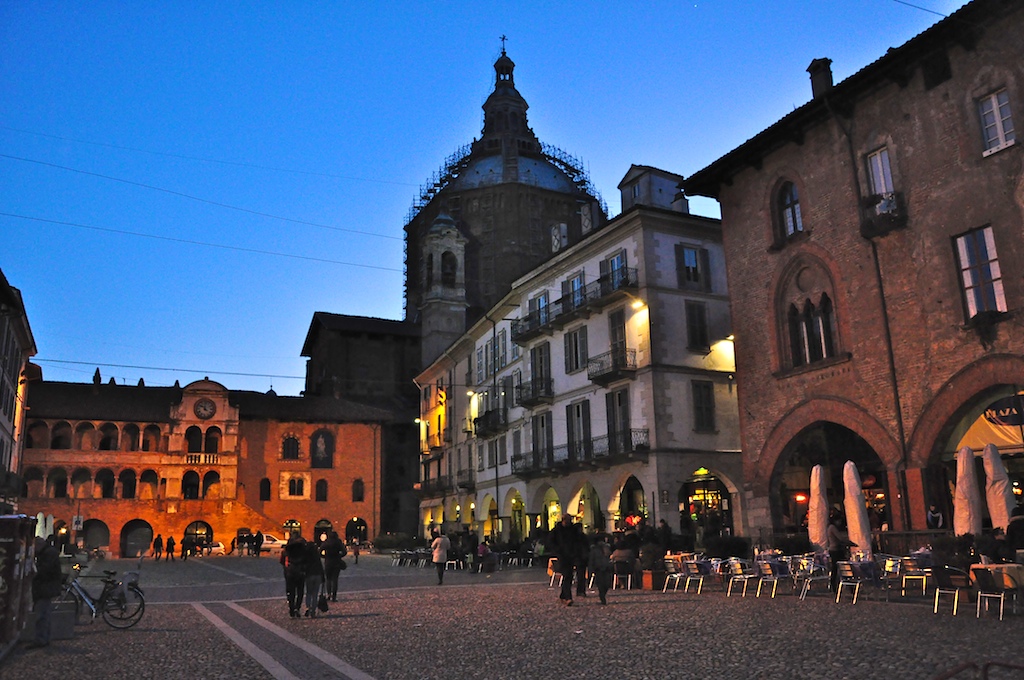

About Our Data
The data on this page is estimated using a number of publicly available tools and resources. It is provided without warranty, and could contain inaccuracies. Use at your own risk.