Industries
Business Distribution by Industry in Faraya
| Industry Description | Number of Establishments |
|---|---|
| Restaurants | 35 |
| Hotels and motels | 16 |
| Holiday homes, cabins and resorts | 13 |
| Other accommodation | 11 |
Faraya Facts
| Area | 8.4 km² |
| Population | 4,488 |
| Male Population | 2,290 (51.0%) |
| Female Population | 2,198 (49.0%) |
| Population change (1975 to 2020) | +228.3% |
| Population change (2000 to 2020) | +146.2% |
| Median Age | 28.2 years (Male: 29.6, Female: 26.8) |
| Local Time | |
| Timezone | Eastern European Summer Time |
| Lat & Lng | 34.01611, 35.82139 |
Map of Faraya
Interactive Map
Faraya Population
Years 1975 to 2030
| Data | 1975 | 1990 | 2000 | 2015 | 2020 | 2025* | 2030* |
|---|---|---|---|---|---|---|---|
| Population | 1,367 | 1,594 | 1,823 | 2,838 | 4,488 | 4,326 | 4,507 |
| Population Density | 163.2 / km² | 190.3 / km² | 217.7 / km² | 338.9 / km² | 535.9 / km² | 516.5 / km² | 538.1 / km² |
Faraya Population change from 2000 to 2020
Increase of 146.2% from year 2000 to 2020
| Location | Change since 1975 | Change since 1990 | Change since 2000 |
|---|---|---|---|
| Faraya | +228.3% | +181.6% | +146.2% |
| Mount Lebanon Governorate | — | — | — |
| Lebanon | — | — | — |
Faraya Median Age
Median Age: 28.2 years
| Location | Median Age | Median Age (Female) | Median Age (Male) |
|---|---|---|---|
| Faraya | 28.2 yrs | 26.8 yrs | 29.6 yrs |
| Mount Lebanon Governorate | 28.2 yrs | 26.8 yrs | 29.6 yrs |
| Lebanon | 28.2 yrs | 26.8 yrs | 29.6 yrs |
Faraya Population Density
Population Density: 536 / km²
| Location | Population | Area | Density |
|---|---|---|---|
| Faraya | 4,488 | 8.4 km² | 536 / km² |
| Mount Lebanon Governorate | 2.6 million | 1,966.9 km² | 1,303 / km² |
| Lebanon | 5.8 million | 10,226.1 km² | 567 / km² |
Faraya Historical and Projected Population
Estimated Population from 0 to 2100
- JRC (European Commission's Joint Research Centre) work on the GHS built-up grid
- CIESIN (Center for International Earth Science Information Network)
- [Link] Klein Goldewijk, K., Beusen, A., Doelman, J., and Stehfest, E.: Anthropogenic land use estimates for the Holocene – HYDE 3.2, Earth Syst. Sci. Data, 9, 927–953, https://doi.org/10.5194/essd-9-927-2017, 2017.
Area Codes
Percentage Area Codes used by businesses in Faraya
Price Distribution
Business distribution by price for Faraya
Human Development Index (HDI)
Statistic composite index of life expectancy, education, and per capita income.
Faraya CO2 Emissions
Carbon Dioxide (CO2) Emissions Per Capita in Tonnes Per Year
| Location | CO2 Emissions | CO2 Emissions Per Capita | CO2 Emissions Intensity |
|---|---|---|---|
| Faraya | 30,478 tn | 6.79 tn | 3,639.2 tons/km² |
| Mount Lebanon Governorate | 17,167,203 tn | 6.7 tn | 8,728 tons/km² |
| Lebanon | 32,952,252 tn | 5.68 tn | 3,222.4 tons/km² |
| 2013 CO2 emissions (tonnes/year) | 30,478 tn |
| 2013 CO2 emissions (tonnes/year) per capita | 6.79 tn |
| 2013 CO2 emissions intensity (tonnes/km²/year) | 3,639.2 tons/km² |
Natural Hazards Risk
Relative risk out of 10
| Hazard | Risk Level |
|---|---|
| Drought | High (9) |
| Flood | Medium (4) |
| Earthquake | Medium (7) |
| Landslide | Medium (7) |
* Risk, particularly concerning flood or landslide, may not be for the entire area.
- Dilley, M., R.S. Chen, U. Deichmann, A.L. Lerner-Lam, M. Arnold, J. Agwe, P. Buys, O. Kjekstad, B. Lyon, and G. Yetman. 2005. Natural Disaster Hotspots: A Global Risk Analysis. Washington, D.C.: World Bank. https://doi.org/10.1596/0-8213-5930-4.
- Center for Hazards and Risk Research - CHRR - Columbia University, Center for International Earth Science Information Network - CIESIN - Columbia University, and Norwegian Geotechnical Institute - NGI. 2005. Global Landslide Hazard Distribution. Palisades, NY: NASA Socioeconomic Data and Applications Center (SEDAC). https://doi.org/10.7927/H4P848VZ.
- Center for Hazards and Risk Research - CHRR - Columbia University, Center for International Earth Science Information Network - CIESIN - Columbia University, and International Research Institute for Climate and Society - IRI - Columbia University. 2005. Global Drought Hazard Frequency and Distribution. Palisades, NY: NASA Socioeconomic Data and Applications Center (SEDAC). https://doi.org/10.7927/H4VX0DFT.
- Center for Hazards and Risk Research - CHRR - Columbia University, Center for International Earth Science Information Network - CIESIN - Columbia University. 2005. Global Flood Hazard Frequency and Distribution. Palisades, NY: NASA Socioeconomic Data and Applications Center (SEDAC). https://doi.org/10.7927/H4668B3D.
- Center for Hazards and Risk Research - CHRR - Columbia University, Center for International Earth Science Information Network - CIESIN - Columbia University. 2005. Global Earthquake Hazard Distribution - Peak Ground Acceleration. Palisades, NY: NASA Socioeconomic Data and Applications Center (SEDAC). https://doi.org/10.7927/H4BZ63ZS.
Recent Nearby Earthquakes
Magnitude 3.0 and greater
| Date▼ | Time↕ | Magnitude↕ | Distance↕ | Depth↕ | Location↕ | Link |
|---|---|---|---|---|---|---|
| 4/29/19 | 12:07 PM | 3.4 | 36.4 km | 10,000 m | 16km ESE of Bcharre, Lebanon | usgs.gov |
| 12/14/18 | 3:27 PM | 3.2 | 61 km | 10,000 m | 23km WNW of Tripoli, Lebanon | usgs.gov |
| 11/3/18 | 5:42 PM | 3.8 | 92.8 km | 32,140 m | 44km WNW of Sidon, Lebanon | usgs.gov |
| 6/29/16 | 1:24 PM | 3.7 | 53 km | 13,850 m | 19km WSW of Beirut, Lebanon | usgs.gov |
| 9/1/14 | 8:50 PM | 4.4 | 40.6 km | 10,000 m | 4km S of Sirghaya, Syria | usgs.gov |
| 7/5/14 | 9:41 PM | 4 | 61.7 km | 12,700 m | 3km NE of Sidon, Lebanon | usgs.gov |
| 5/25/14 | 12:22 PM | 3.8 | 35.5 km | 21,550 m | 16km WNW of Jbail, Lebanon | usgs.gov |
| 7/10/09 | 6:19 PM | 4 | 90.3 km | 10,000 m | Lebanon - Syria region | usgs.gov |
| 7/2/08 | 9:29 AM | 3.1 | 69.9 km | 20,100 m | Lebanon - Syria region | usgs.gov |
| 6/23/08 | 3:45 PM | 3 | 88.3 km | 1,000 m | Lebanon - Syria region | usgs.gov |
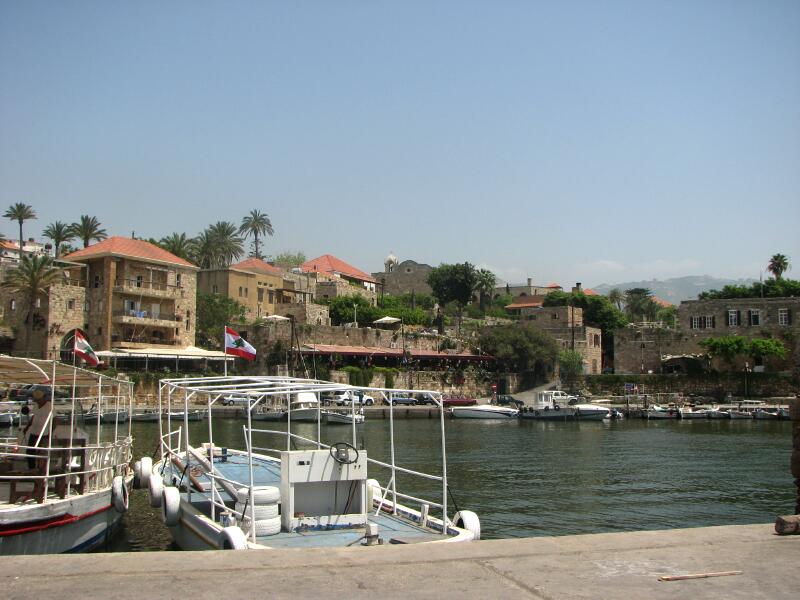
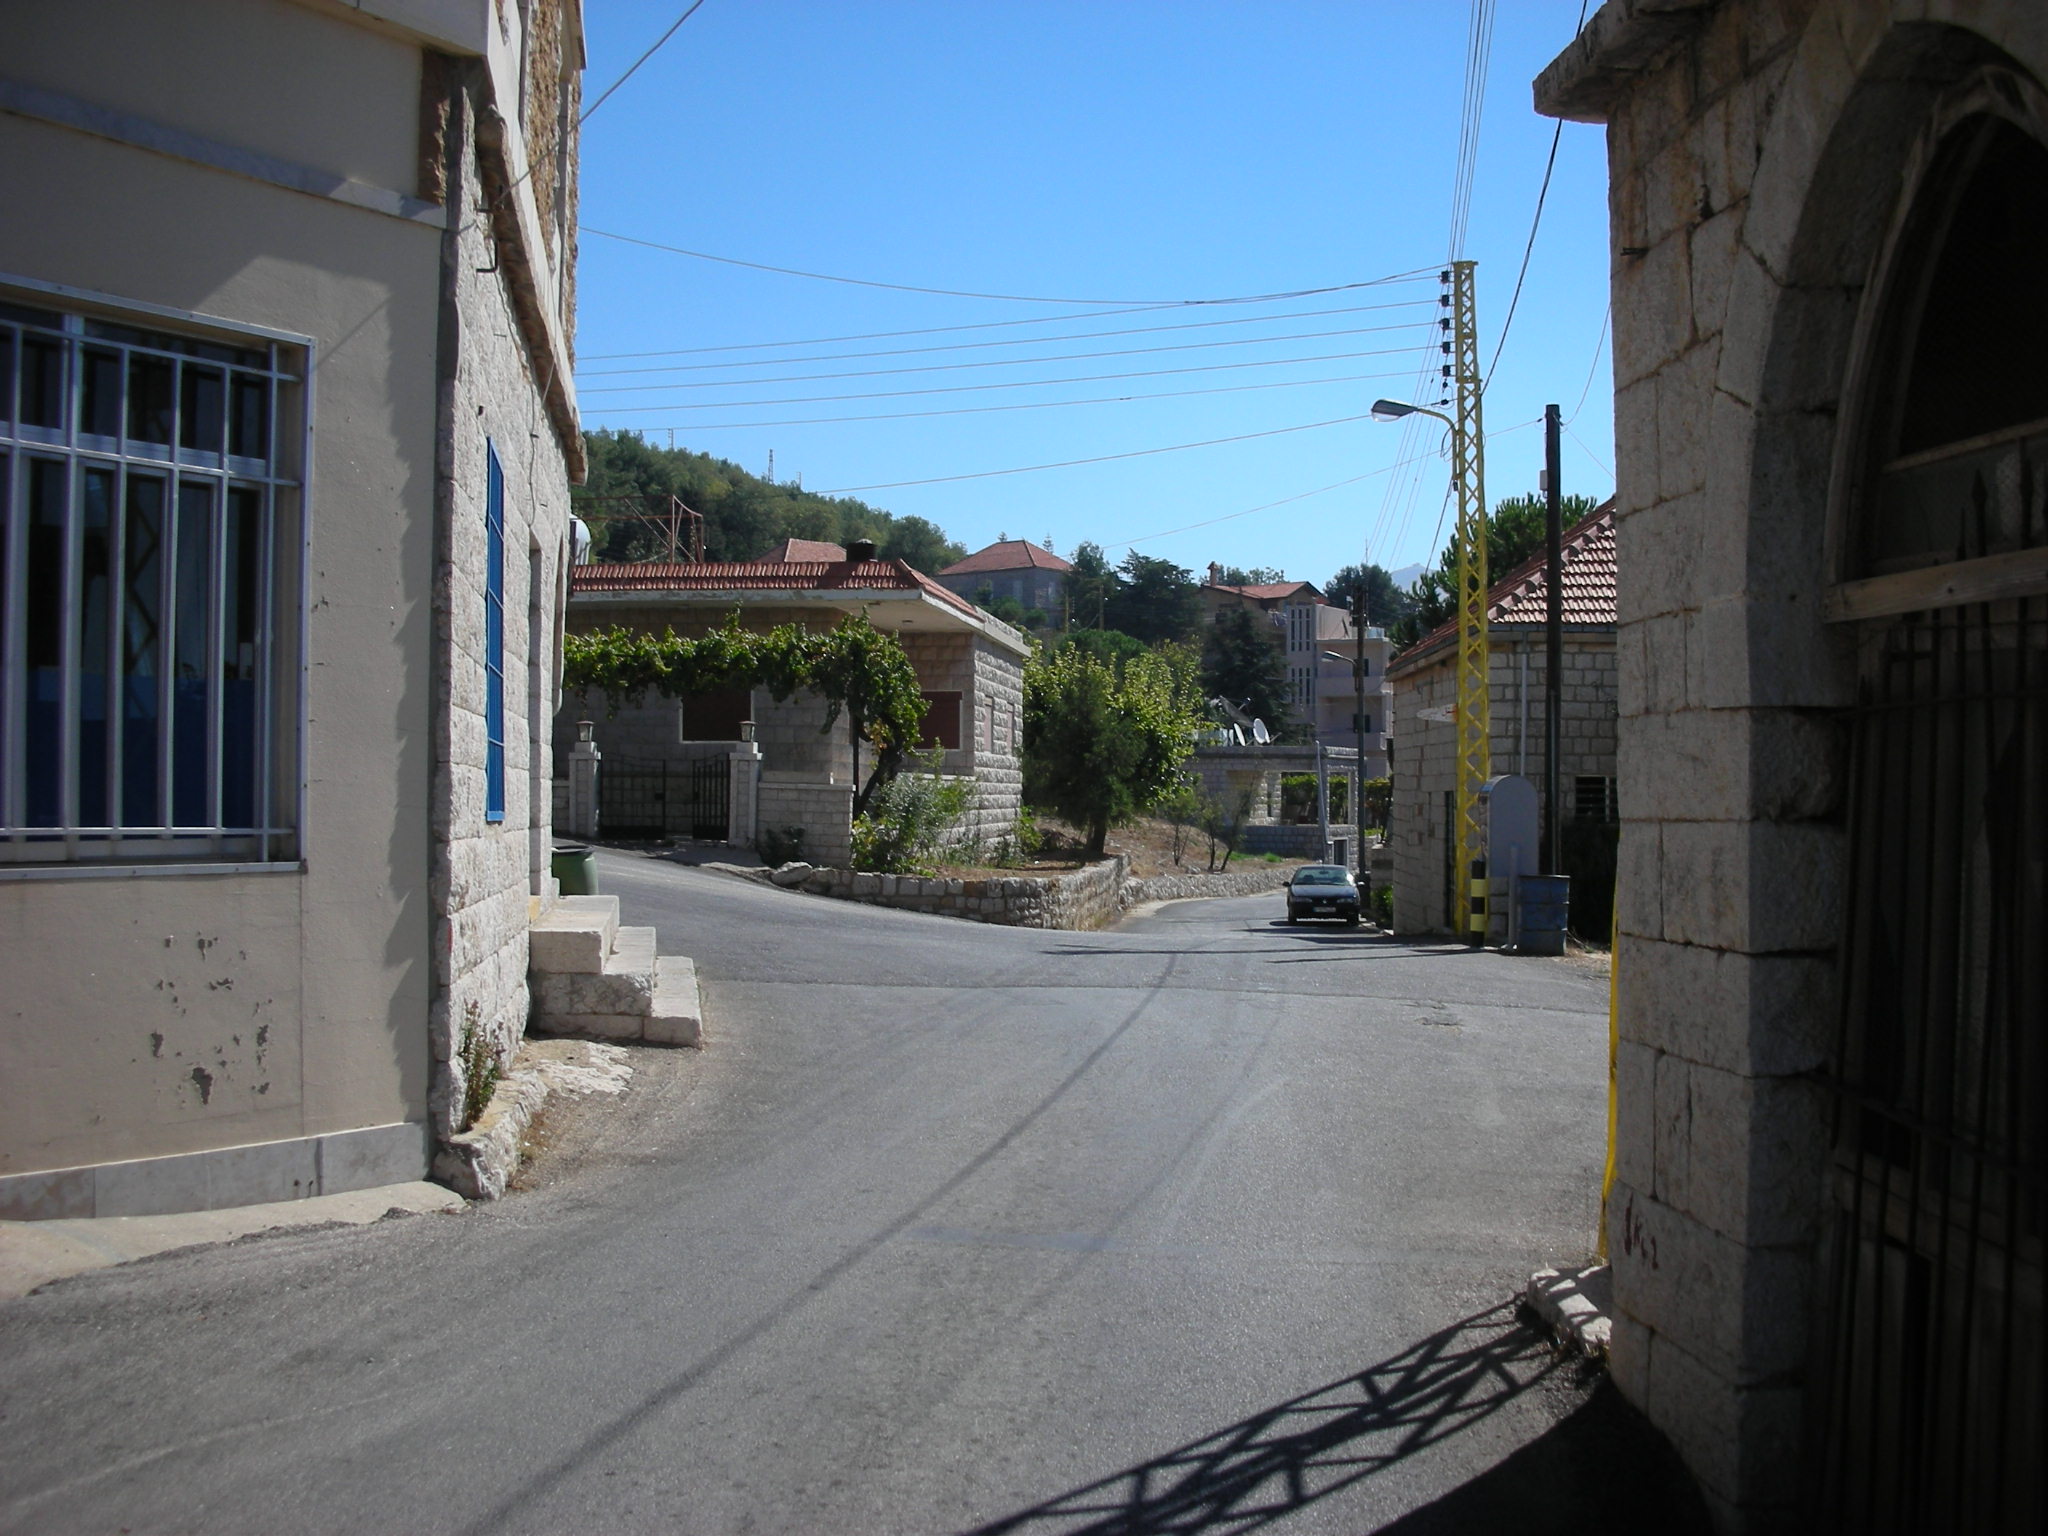
Faraya
Faraya (Arabic: فاريا) is a village and municipality in the Keserwan District of the Mount Lebanon Governorate, Lebanon. It is located 46 kilometers north of Beirut. Its average elevation is 1,850 meters above sea level and its total land area is 87..
Faraya Wikipedia Page

About Our Data
The data on this page is estimated using a number of publicly available tools and resources. It is provided without warranty, and could contain inaccuracies. Use at your own risk.