Hbaline Facts
| Area | 1.8 km² |
| Population | 296 |
| Male Population | 151 (51.0%) |
| Female Population | 145 (49.0%) |
| Population change (1975 to 2020) | -55.2% |
| Population change (2000 to 2020) | -10.6% |
| Median Age | 28.2 years (Male: 29.6, Female: 26.8) |
| Local Time | |
| Timezone | Eastern European Summer Time |
| Lat & Lng | 34.15944, 35.68556 |
Map of Hbaline
Interactive Map
Hbaline Population
Years 1975 to 2020
| Data | 1975 | 1990 | 2000 | 2015 | 2020 |
|---|---|---|---|---|---|
| Population | 661 | 407 | 331 | 285 | 296 |
| Population Density | 377.7 / km² | 232.6 / km² | 189.1 / km² | 162.9 / km² | 169.1 / km² |
Hbaline Population change from 2000 to 2015
Decrease of 13.9% from year 2000 to 2015
| Location | Change since 1975 | Change since 1990 | Change since 2000 |
|---|---|---|---|
| Hbaline | -56.9% | -30% | -13.9% |
| Mount Lebanon Governorate | +301.2% | +200.3% | +117.6% |
| Lebanon | +128% | +116.8% | +81% |
Hbaline Median Age
Median Age: 28.2 years
| Location | Median Age | Median Age (Female) | Median Age (Male) |
|---|---|---|---|
| Hbaline | 28.2 yrs | 26.8 yrs | 29.6 yrs |
| Mount Lebanon Governorate | 28.2 yrs | 26.8 yrs | 29.6 yrs |
| Lebanon | 28.2 yrs | 26.8 yrs | 29.6 yrs |
Hbaline Population Density
Population Density: 169 / km²
| Location | Population | Area | Density |
|---|---|---|---|
| Hbaline | 296 | 1.75 km² | 169 / km² |
| Mount Lebanon Governorate | 2.6 million | 1,966.9 km² | 1,303 / km² |
| Lebanon | 5.8 million | 10,226.1 km² | 567 / km² |
Hbaline Historical and Projected Population
Estimated Population from 0 to 2100
- JRC (European Commission's Joint Research Centre) work on the GHS built-up grid
- CIESIN (Center for International Earth Science Information Network)
- [Link] Klein Goldewijk, K., Beusen, A., Doelman, J., and Stehfest, E.: Anthropogenic land use estimates for the Holocene – HYDE 3.2, Earth Syst. Sci. Data, 9, 927–953, https://doi.org/10.5194/essd-9-927-2017, 2017.
Human Development Index (HDI)
Statistic composite index of life expectancy, education, and per capita income.
Hbaline CO2 Emissions
Carbon Dioxide (CO2) Emissions Per Capita in Tonnes Per Year
| Location | CO2 Emissions | CO2 Emissions Per Capita | CO2 Emissions Intensity |
|---|---|---|---|
| Hbaline | 1,569 tn | 5.3 tn | 896.7 tons/km² |
| Mount Lebanon Governorate | 17,167,203 tn | 6.7 tn | 8,728 tons/km² |
| Lebanon | 32,952,252 tn | 5.68 tn | 3,222.4 tons/km² |
| 2013 CO2 emissions (tonnes/year) | 1,569 tn |
| 2013 CO2 emissions (tonnes/year) per capita | 5.3 tn |
| 2013 CO2 emissions intensity (tonnes/km²/year) | 896.7 tons/km² |
Natural Hazards Risk
Relative risk out of 10
| Hazard | Risk Level |
|---|---|
| Drought | High (9) |
| Flood | Medium (4) |
| Earthquake | Medium (7) |
* Risk, particularly concerning flood or landslide, may not be for the entire area.
- Dilley, M., R.S. Chen, U. Deichmann, A.L. Lerner-Lam, M. Arnold, J. Agwe, P. Buys, O. Kjekstad, B. Lyon, and G. Yetman. 2005. Natural Disaster Hotspots: A Global Risk Analysis. Washington, D.C.: World Bank. https://doi.org/10.1596/0-8213-5930-4.
- Center for Hazards and Risk Research - CHRR - Columbia University, Center for International Earth Science Information Network - CIESIN - Columbia University, and International Research Institute for Climate and Society - IRI - Columbia University. 2005. Global Drought Hazard Frequency and Distribution. Palisades, NY: NASA Socioeconomic Data and Applications Center (SEDAC). https://doi.org/10.7927/H4VX0DFT.
- Center for Hazards and Risk Research - CHRR - Columbia University, Center for International Earth Science Information Network - CIESIN - Columbia University. 2005. Global Flood Hazard Frequency and Distribution. Palisades, NY: NASA Socioeconomic Data and Applications Center (SEDAC). https://doi.org/10.7927/H4668B3D.
- Center for Hazards and Risk Research - CHRR - Columbia University, Center for International Earth Science Information Network - CIESIN - Columbia University. 2005. Global Earthquake Hazard Distribution - Peak Ground Acceleration. Palisades, NY: NASA Socioeconomic Data and Applications Center (SEDAC). https://doi.org/10.7927/H4BZ63ZS.
Recent Nearby Earthquakes
Magnitude 3.0 and greater
| Date▼ | Time↕ | Magnitude↕ | Distance↕ | Depth↕ | Location↕ | Link |
|---|---|---|---|---|---|---|
| 4/29/19 | 12:07 PM | 3.4 | 44.3 km | 10,000 m | 16km ESE of Bcharre, Lebanon | usgs.gov |
| 12/14/18 | 3:27 PM | 3.2 | 42.6 km | 10,000 m | 23km WNW of Tripoli, Lebanon | usgs.gov |
| 11/3/18 | 5:42 PM | 3.8 | 89.9 km | 32,140 m | 44km WNW of Sidon, Lebanon | usgs.gov |
| 6/29/16 | 1:24 PM | 3.7 | 53.1 km | 13,850 m | 19km WSW of Beirut, Lebanon | usgs.gov |
| 9/1/14 | 8:50 PM | 4.4 | 60.7 km | 10,000 m | 4km S of Sirghaya, Syria | usgs.gov |
| 7/5/14 | 9:41 PM | 4 | 68.9 km | 12,700 m | 3km NE of Sidon, Lebanon | usgs.gov |
| 5/25/14 | 12:22 PM | 3.8 | 19.6 km | 21,550 m | 16km WNW of Jbail, Lebanon | usgs.gov |
| 7/10/09 | 6:19 PM | 4 | 99.8 km | 10,000 m | Lebanon - Syria region | usgs.gov |
| 7/2/08 | 9:29 AM | 3.1 | 82.3 km | 20,100 m | Lebanon - Syria region | usgs.gov |
| 6/23/08 | 3:45 PM | 3 | 99.3 km | 1,000 m | Lebanon - Syria region | usgs.gov |
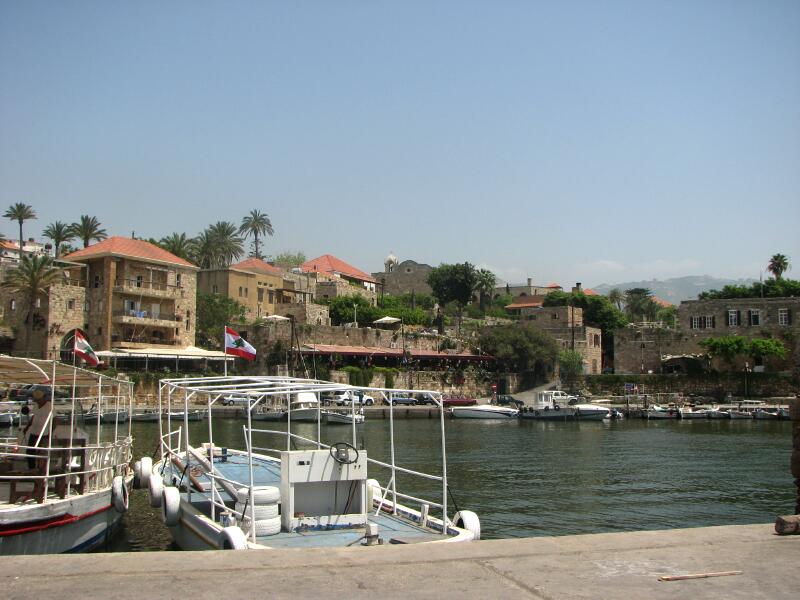
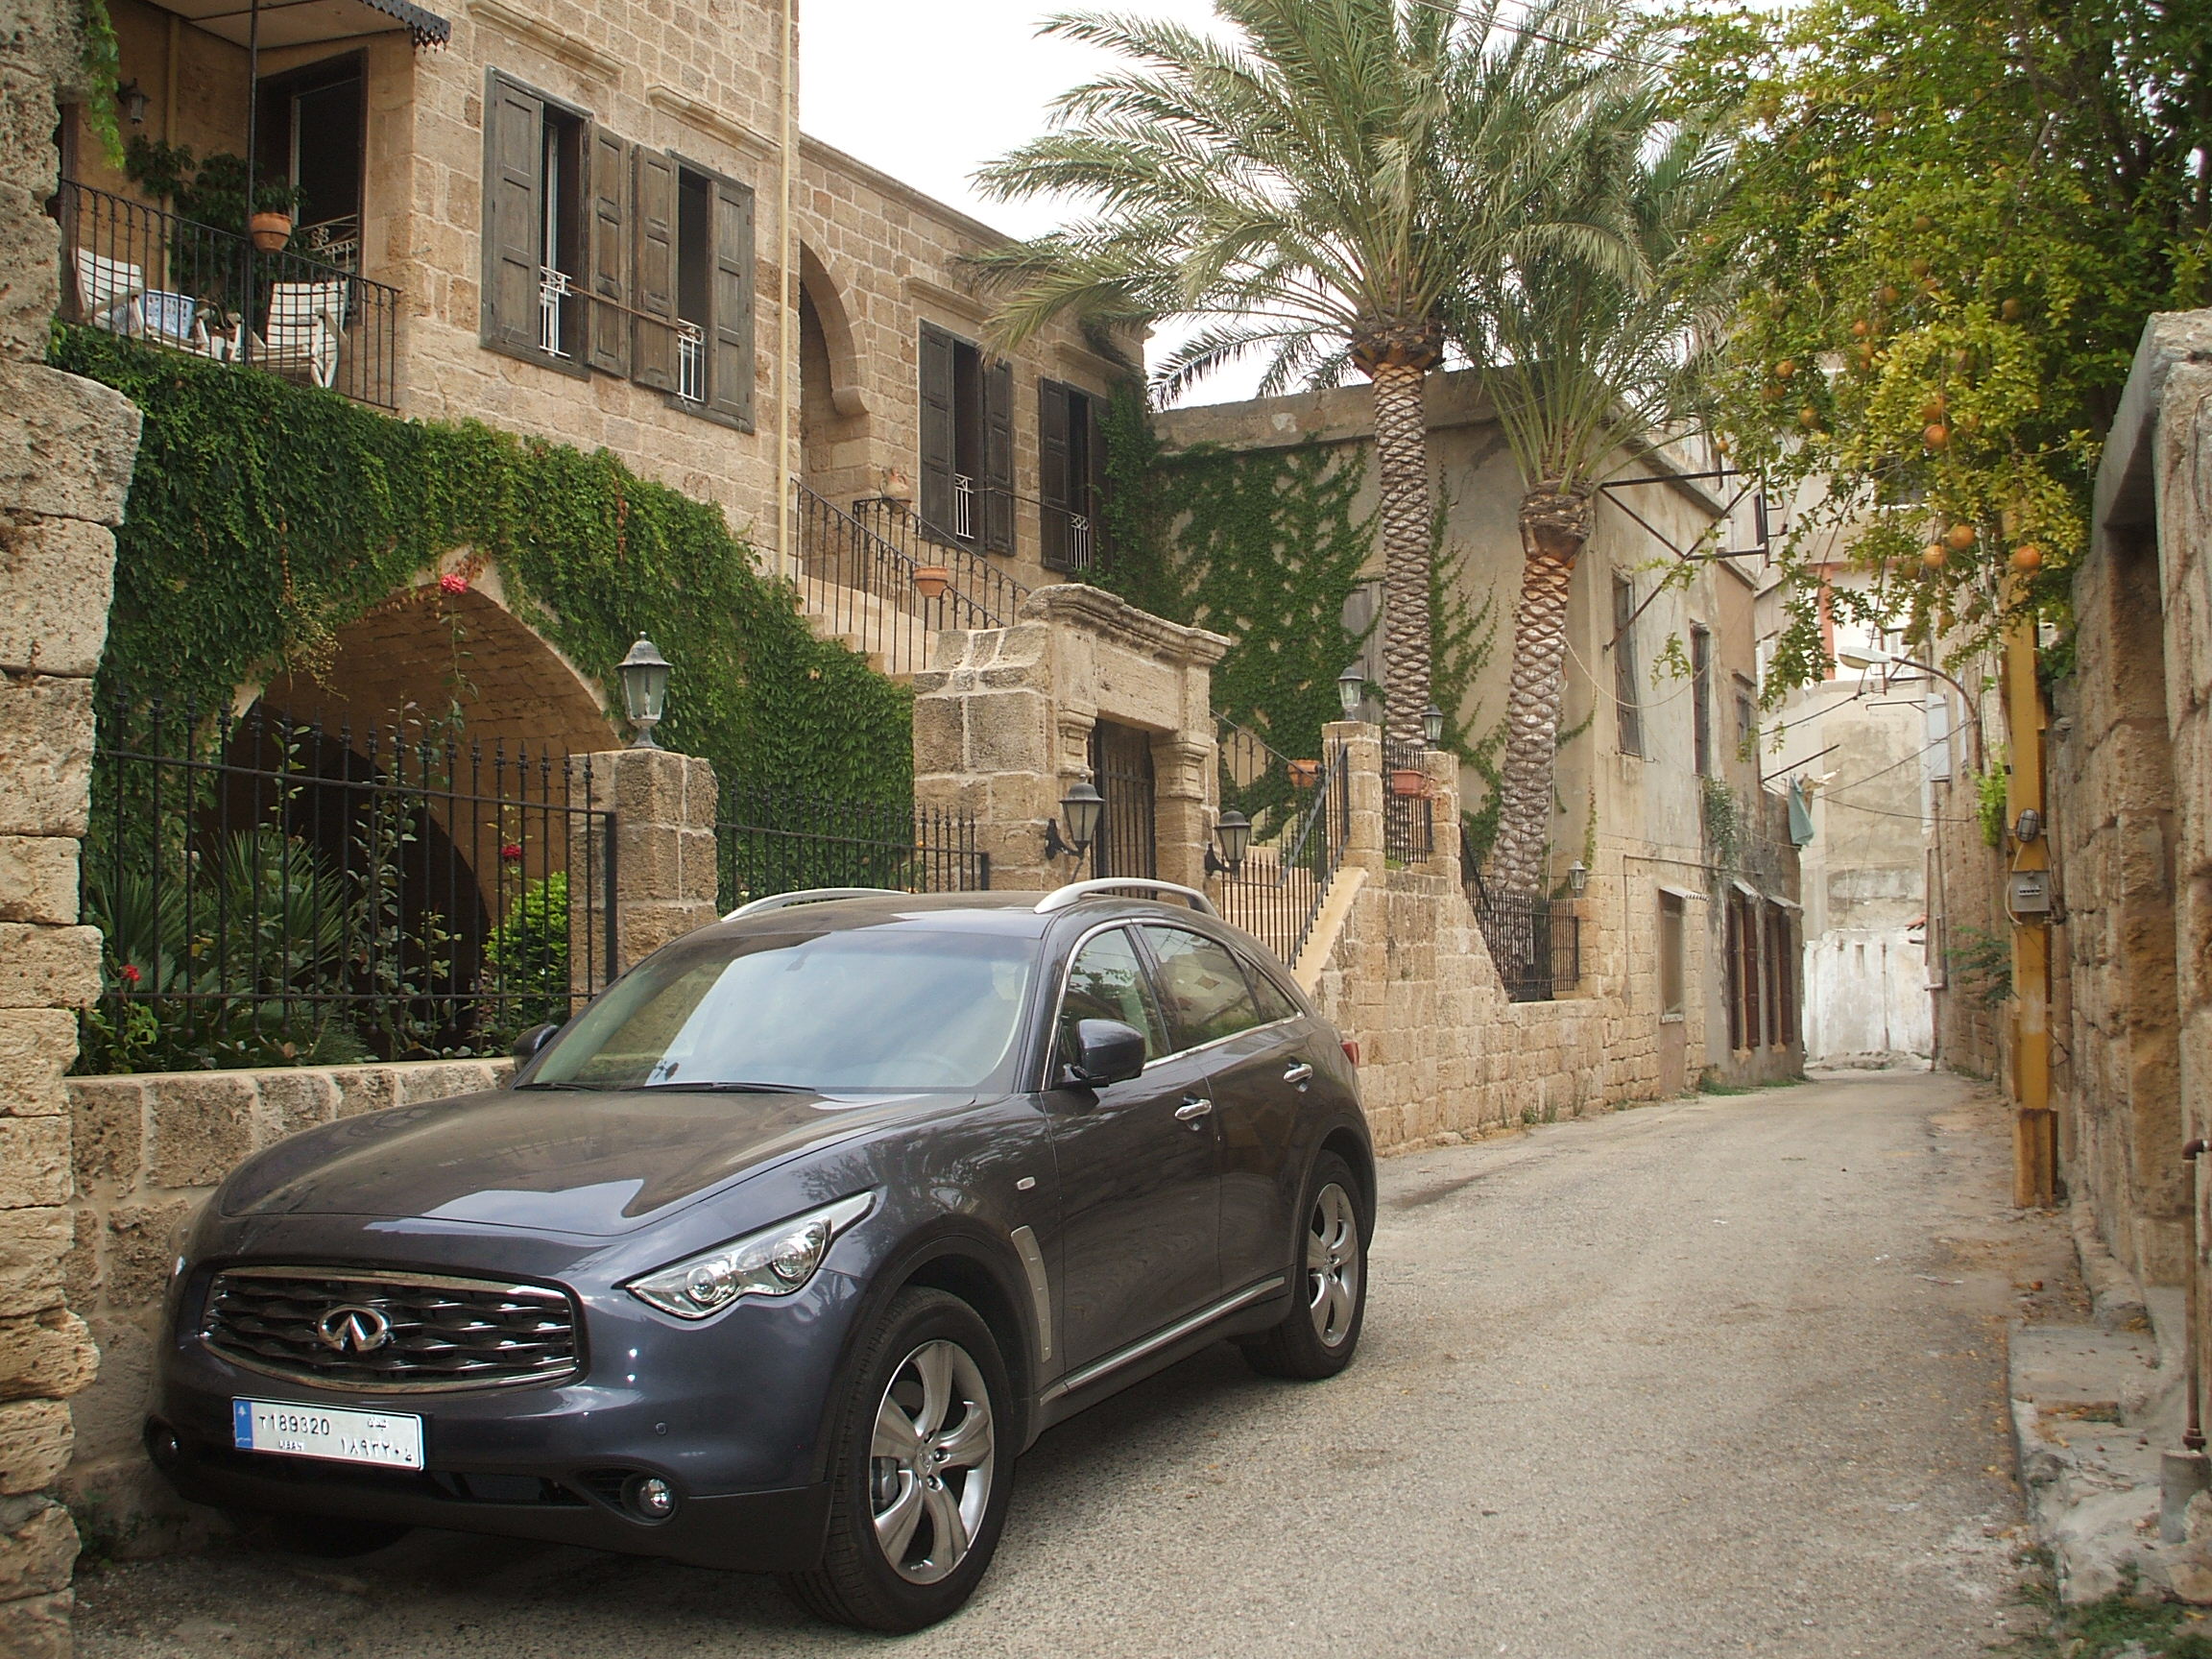
Hbaline
Hbaline (Template:Lang-aramaic) is a small village in Jbeil-Byblos-Lebanon located 44 km north of Beirut and at an altitude of 540 meters, just above Amchit and Gherfine and before BeitHabbak. Hbaline is located on a small hill. Its eastern side over..
Hbaline Wikipedia Page

About Our Data
The data on this page is estimated using a number of publicly available tools and resources. It is provided without warranty, and could contain inaccuracies. Use at your own risk.