Categories in Labanoras
Industries
Business Distribution by Industry in Labanoras
| Industry Description | Number of Establishments |
|---|---|
| Sports and recreation | 12 |
| Campgrounds | 6 |
Labanoras Facts
| Area | 272.2 km² |
| Population | 74 |
| Male Population | 36 (48.3%) |
| Female Population | 38 (51.7%) |
| Population change (1975 to 2020) | +85.0% |
| Population change (2000 to 2020) | -10.8% |
| Median Age | 42.2 years (Male: 39.5, Female: 44.8) |
| Local Time | |
| Timezone | Eastern European Summer Time |
| Lat & Lng | 55.26667, 25.76667 |
| Postal Codes | 18025, 18201, 18202, 18235, 18236 |
Map of Labanoras
Interactive Map
Labanoras Population
Years 1975 to 2020
| Data | 1975 | 1990 | 2000 | 2015 | 2020 |
|---|---|---|---|---|---|
| Population | 40 | 66 | 83 | 78 | 74 |
| Population Density | 0.1 / km² | 0.2 / km² | 0.3 / km² | 0.3 / km² | 0.3 / km² |
Labanoras Population change from 2000 to 2015
Decrease of 6% from year 2000 to 2015
| Location | Change since 1975 | Change since 1990 | Change since 2000 |
|---|---|---|---|
| Labanoras | +95% | +18.2% | -6% |
| Lithuania | -12.8% | -22.2% | -17.4% |
Labanoras Median Age
Median Age: 42.2 years
| Location | Median Age | Median Age (Female) | Median Age (Male) |
|---|---|---|---|
| Labanoras | 42.2 yrs | 44.8 yrs | 39.5 yrs |
| Lithuania | 39.7 yrs | 42.1 yrs | 37 yrs |
Labanoras Population Density
Population Density: 0.3 / km²
| Location | Population | Area | Density |
|---|---|---|---|
| Labanoras | 74 | 272.2 km² | 0.3 / km² |
| Lithuania | 2.9 million | 65,263.1 km² | 44.1 / km² |
Labanoras Historical and Projected Population
Estimated Population from 0 to 2100
- JRC (European Commission's Joint Research Centre) work on the GHS built-up grid
- CIESIN (Center for International Earth Science Information Network)
- [Link] Klein Goldewijk, K., Beusen, A., Doelman, J., and Stehfest, E.: Anthropogenic land use estimates for the Holocene – HYDE 3.2, Earth Syst. Sci. Data, 9, 927–953, https://doi.org/10.5194/essd-9-927-2017, 2017.
Human Development Index (HDI)
Statistic composite index of life expectancy, education, and per capita income.
Labanoras CO2 Emissions
Carbon Dioxide (CO2) Emissions Per Capita in Tonnes Per Year
| Location | CO2 Emissions | CO2 Emissions Per Capita | CO2 Emissions Intensity |
|---|---|---|---|
| Labanoras | 674 tn | 9.11 tn | 2.5 tons/km² |
| Lithuania | 23,559,934 tn | 8.18 tn | 361 tons/km² |
| 2013 CO2 emissions (tonnes/year) | 674 tn |
| 2013 CO2 emissions (tonnes/year) per capita | 9.11 tn |
| 2013 CO2 emissions intensity (tonnes/km²/year) | 2.5 tons/km² |
Labanoras
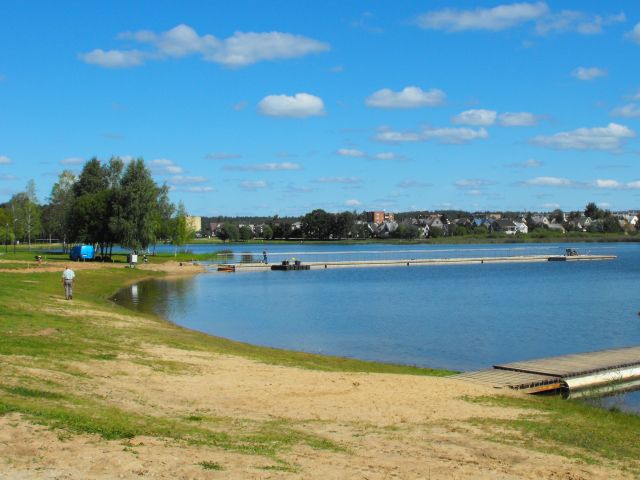
Labanoras is a small town within the Labanoras Regional Park in Lithuania. It is situated on Lake Labanoras and is surrounded by the Labanoras Forest, the largest forest in Lithuania. As a center of the regional park, the town attracts tourists. A ho..
Labanoras Wikipedia Page


About Our Data
The data on this page is estimated using a number of publicly available tools and resources. It is provided without warranty, and could contain inaccuracies. Use at your own risk.