Categories in Obeliai
Obeliai Facts
| Area | 356.1 km² |
| Population | 5,203 |
| Male Population | 2,494 (47.9%) |
| Female Population | 2,709 (52.1%) |
| Population change (1975 to 2020) | -30.4% |
| Population change (2000 to 2020) | -15.6% |
| Median Age | 43.2 years (Male: 40.8, Female: 45.5) |
| Local Time | |
| Timezone | Eastern European Summer Time |
| Lat & Lng | 55.93333, 25.80000 |
| Postal Codes | 42006, 42202, 42205, 42206, 42208, More |
Map of Obeliai
Interactive Map
Obeliai Population
Years 1975 to 2020
| Data | 1975 | 1990 | 2000 | 2015 | 2020 |
|---|---|---|---|---|---|
| Population | 7,476 | 6,895 | 6,162 | 5,515 | 5,203 |
| Population Density | 21 / km² | 19.4 / km² | 17.3 / km² | 15.5 / km² | 14.6 / km² |
Obeliai Population change from 2000 to 2015
Decrease of 10.5% from year 2000 to 2015
| Location | Change since 1975 | Change since 1990 | Change since 2000 |
|---|---|---|---|
| Obeliai | -26.2% | -20% | -10.5% |
| Lithuania | -12.8% | -22.2% | -17.4% |
Obeliai Median Age
Median Age: 43.2 years
| Location | Median Age | Median Age (Female) | Median Age (Male) |
|---|---|---|---|
| Obeliai | 43.2 yrs | 45.5 yrs | 40.8 yrs |
| Lithuania | 39.7 yrs | 42.1 yrs | 37 yrs |
Obeliai Population Density
Population Density: 14.6 / km²
| Location | Population | Area | Density |
|---|---|---|---|
| Obeliai | 5,203 | 356.1 km² | 14.6 / km² |
| Lithuania | 2.9 million | 65,263.1 km² | 44.1 / km² |
Obeliai Historical and Projected Population
Estimated Population from 0 to 2100
- JRC (European Commission's Joint Research Centre) work on the GHS built-up grid
- CIESIN (Center for International Earth Science Information Network)
- [Link] Klein Goldewijk, K., Beusen, A., Doelman, J., and Stehfest, E.: Anthropogenic land use estimates for the Holocene – HYDE 3.2, Earth Syst. Sci. Data, 9, 927–953, https://doi.org/10.5194/essd-9-927-2017, 2017.
Postal Codes
Percentage of businesses by Postal Codes in Obeliai
Human Development Index (HDI)
Statistic composite index of life expectancy, education, and per capita income.
Obeliai CO2 Emissions
Carbon Dioxide (CO2) Emissions Per Capita in Tonnes Per Year
| Location | CO2 Emissions | CO2 Emissions Per Capita | CO2 Emissions Intensity |
|---|---|---|---|
| Obeliai | 40,395 tn | 7.76 tn | 113.4 tons/km² |
| Lithuania | 23,559,934 tn | 8.18 tn | 361 tons/km² |
| 2013 CO2 emissions (tonnes/year) | 40,395 tn |
| 2013 CO2 emissions (tonnes/year) per capita | 7.76 tn |
| 2013 CO2 emissions intensity (tonnes/km²/year) | 113.4 tons/km² |
Obeliai
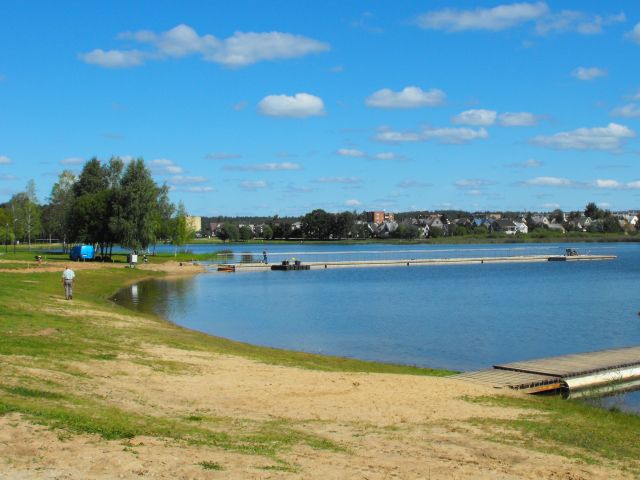
Obeliai ( pronunciation ) is a small city in the Rokiškis district municipality of Panevėžys County, Lithuania. At the foot of the town is one of the area's many lakes. area of Lithuania is known as 'Little Switzerland' due to the beauty of the coun..
Obeliai Wikipedia Page


About Our Data
The data on this page is estimated using a number of publicly available tools and resources. It is provided without warranty, and could contain inaccuracies. Use at your own risk.