Industries
Business Distribution by Industry in Rietavas
| Industry Description | Number of Establishments | Average Google Rating |
|---|---|---|
| Shopping | 18 | 3.9 |
| Department stores | 13 | 3.9 |
Rietavas Facts
| Area | 4.6 km² |
| Population | 4,531 |
| Male Population | 2,209 (48.7%) |
| Female Population | 2,322 (51.3%) |
| Population change (1975 to 2020) | -48.8% |
| Population change (2000 to 2020) | -33.8% |
| Median Age | 39 years (Male: 36.2, Female: 41.6) |
| Neighborhoods | Maldučiai, Šeškinė |
| Local Time | |
| Timezone | Eastern European Summer Time |
| Lat & Lng | 55.71944, 21.93111 |
| Postal Codes | 90012, 90015, 90018, 90301, 90303, More |
Map of Rietavas
Interactive Map
Rietavas Population
Years 1975 to 2020
| Data | 1975 | 1990 | 2000 | 2015 | 2020 |
|---|---|---|---|---|---|
| Population | 8,852 | 8,139 | 6,840 | 4,791 | 4,531 |
| Population Density | 1,913.9 / km² | 1,759.8 / km² | 1,478.9 / km² | 1,035.9 / km² | 979.7 / km² |
Rietavas Population change from 2000 to 2015
Decrease of 30% from year 2000 to 2015
| Location | Change since 1975 | Change since 1990 | Change since 2000 |
|---|---|---|---|
| Rietavas | -45.9% | -41.1% | -30% |
| Lithuania | -12.8% | -22.2% | -17.4% |
Rietavas Median Age
Median Age: 39 years
| Location | Median Age | Median Age (Female) | Median Age (Male) |
|---|---|---|---|
| Rietavas | 39 yrs | 41.6 yrs | 36.2 yrs |
| Lithuania | 39.7 yrs | 42.1 yrs | 37 yrs |
Rietavas Population Density
Population Density: 980 / km²
| Location | Population | Area | Density |
|---|---|---|---|
| Rietavas | 4,531 | 4.625 km² | 980 / km² |
| Lithuania | 2.9 million | 65,263.1 km² | 44.1 / km² |
Rietavas Historical and Projected Population
Estimated Population from 0 to 2100
- JRC (European Commission's Joint Research Centre) work on the GHS built-up grid
- CIESIN (Center for International Earth Science Information Network)
- [Link] Klein Goldewijk, K., Beusen, A., Doelman, J., and Stehfest, E.: Anthropogenic land use estimates for the Holocene – HYDE 3.2, Earth Syst. Sci. Data, 9, 927–953, https://doi.org/10.5194/essd-9-927-2017, 2017.
Area Codes
Percentage Area Codes used by businesses in Rietavas
Postal Codes
Percentage of businesses by Postal Codes in Rietavas
Human Development Index (HDI)
Statistic composite index of life expectancy, education, and per capita income.
Rietavas CO2 Emissions
Carbon Dioxide (CO2) Emissions Per Capita in Tonnes Per Year
| Location | CO2 Emissions | CO2 Emissions Per Capita | CO2 Emissions Intensity |
|---|---|---|---|
| Rietavas | 36,411 tn | 8.04 tn | 7,872.6 tons/km² |
| Lithuania | 23,559,934 tn | 8.18 tn | 361 tons/km² |
| 2013 CO2 emissions (tonnes/year) | 36,411 tn |
| 2013 CO2 emissions (tonnes/year) per capita | 8.04 tn |
| 2013 CO2 emissions intensity (tonnes/km²/year) | 7,872.6 tons/km² |
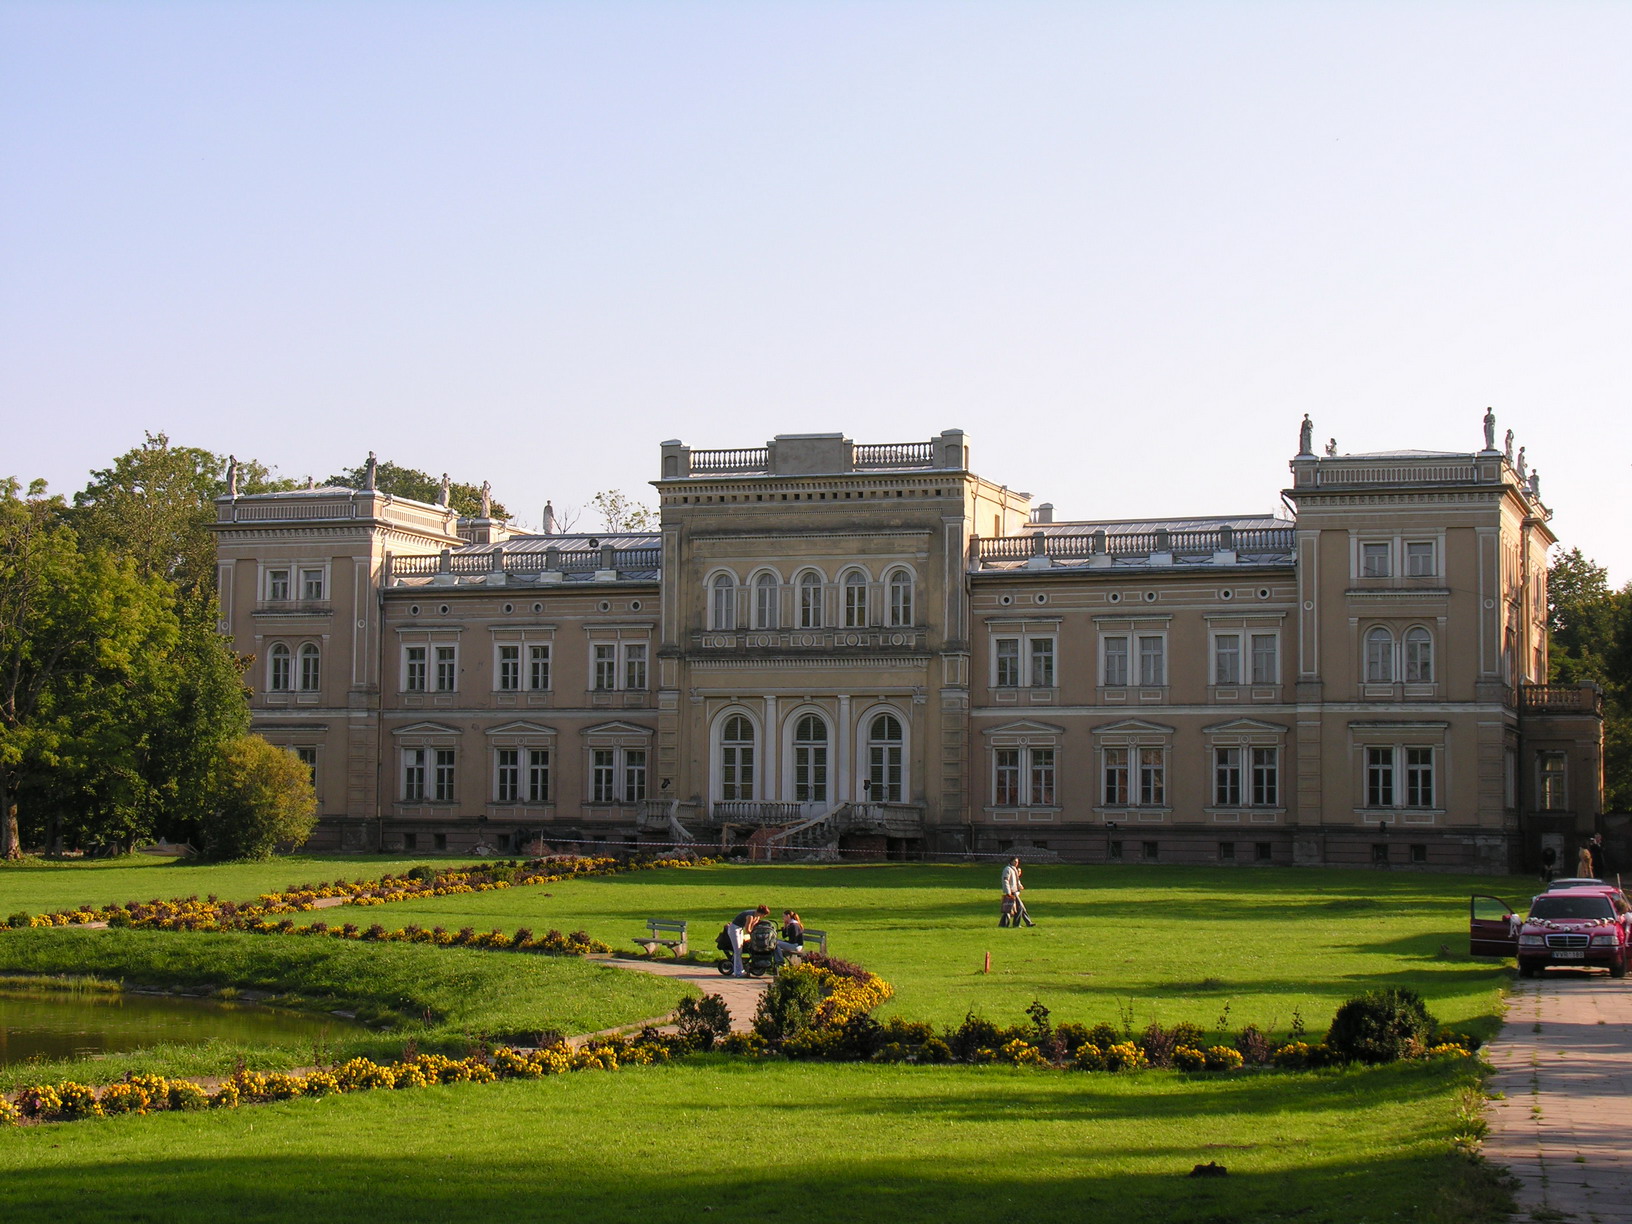
Rietavas
Rietavas ( pronunciation , Samogitian: Rėitavs) is a city in Lithuania on the Jūra River. According to the 2001 census it had a population of 3,979. It is the capital of Rietavas municipality. city is famous for building the first power station to p..
Rietavas Wikipedia Page

About Our Data
The data on this page is estimated using a number of publicly available tools and resources. It is provided without warranty, and could contain inaccuracies. Use at your own risk.