Simnas Facts
| Area | 1.3 km² |
| Population | 231 |
| Male Population | 116 (50.1%) |
| Female Population | 115 (49.9%) |
| Population change (1975 to 2020) | -90.4% |
| Population change (2000 to 2020) | -87.4% |
| Median Age | 43.1 years (Male: 41.3, Female: 45.1) |
| GDP per capita (PPP) | $29,373 (2022) |
| Local Time | |
| Timezone | Eastern European Summer Time |
| Lat & Lng | 54.40000, 23.65000 |
| Postal Codes | 64301, 64302, 64303, 64304, 64305, More |
Map of Simnas
Interactive Map
Simnas Population
Years 1975 to 2030
| Data | 1975 | 1990 | 2000 | 2015 | 2020 | 2025* | 2030* |
|---|---|---|---|---|---|---|---|
| Population | 2,406 | 2,329 | 1,838 | 1,262 | 231 | 210 | 194 |
| Population Density | 1,833.1 / km² | 1,774.5 / km² | 1,400.4 / km² | 961.5 / km² | 176 / km² | 160 / km² | 147.8 / km² |
* Projected
Sources: JRC (European Commission's Joint Research Centre) work on the GHS built-up gridSimnas Population change from 2000 to 2020
Decrease of 87.4% from year 2000 to 2020
| Location | Change since 1975 | Change since 1990 | Change since 2000 |
|---|---|---|---|
| Simnas | -90.4% | -90.1% | -87.4% |
| Lithuania | — | — | — |
Sources: JRC (European Commission's Joint Research Centre) work on the GHS built-up grid
Simnas Median Age
Median Age: 43.1 years
| Location | Median Age | Median Age (Female) | Median Age (Male) |
|---|---|---|---|
| Simnas | 43.1 yrs | 45.1 yrs | 41.3 yrs |
| Lithuania | 39.7 yrs | 42.1 yrs | 37 yrs |
Sources: CIESIN (Center for International Earth Science Information Network)
Simnas Population Density
Population Density: 176 / km²
| Location | Population | Area | Density |
|---|---|---|---|
| Simnas | 231 | 1.313 km² | 176 / km² |
| Lithuania | 2.9 million | 65,263.1 km² | 44.1 / km² |
Sources: JRC (European Commission's Joint Research Centre) work on the GHS built-up grid
Simnas Historical and Projected Population
Estimated Population from 0 to 2100
Sources:
- JRC (European Commission's Joint Research Centre) work on the GHS built-up grid
- CIESIN (Center for International Earth Science Information Network)
- [Link] Klein Goldewijk, K., Beusen, A., Doelman, J., and Stehfest, E.: Anthropogenic land use estimates for the Holocene – HYDE 3.2, Earth Syst. Sci. Data, 9, 927–953, https://doi.org/10.5194/essd-9-927-2017, 2017.
Postal Codes
Percentage of businesses by Postal Codes in Simnas
Human Development Index (HDI)
Statistic composite index of life expectancy, education, and per capita income.
Source: [Link] Kummu, M., Taka, M. &Guillaume, J. Gridded global datasets for Gross Domestic Product and Human Development Index over 1990–2015. Sci Data 5, 180004 (2018) doi:10.1038/sdata.2018.4
Simnas Gross Domestic Product (GDP)
GDP per capita, PPP (constant 2017 international $)
| Data | 1990 | 1995 | 2000 | 2005 | 2010 | 2015 | 2020 | 2022 |
|---|---|---|---|---|---|---|---|---|
| GDP per capita | $16,319 | $11,265 | $14,971 | $16,513 | $18,809 | $22,642 | $27,523 | $29,373 |
| Total GDP | $37.1M | $24.9M | $30.7M | $31.3M | $32.6M | $35.8M | $40.1M | $41.9M |
Source: [Link] Kummu, M., Kosonen, M. & Masoumzadeh Sayyar, S. Downscaled gridded global dataset for gross domestic product (GDP) per capita PPP over 1990–2022. Sci Data 12, 178 (2025) doi:10.1038/s41597-025-04487-x
Simnas CO2 Emissions
Carbon Dioxide (CO2) Emissions Per Capita in Tonnes Per Year
| Location | CO2 Emissions | CO2 Emissions Per Capita | CO2 Emissions Intensity |
|---|---|---|---|
| Simnas | 1,832 tn | 7.93 tn | 1,396.1 tons/km² |
| Lithuania | 23,559,934 tn | 8.18 tn | 361 tons/km² |
Sources: [Link] Moran, D., Kanemoto K; Jiborn, M., Wood, R., Többen, J., and Seto, K.C. (2018) Carbon footprints of 13,000 cities. Environmental Research Letters DOI: 10.1088/1748-9326/aac72a
Simnas CO2 Emissions
| 2013 CO2 emissions (tonnes/year) | 1,832 tn |
| 2013 CO2 emissions (tonnes/year) per capita | 7.93 tn |
| 2013 CO2 emissions intensity (tonnes/km²/year) | 1,396.1 tons/km² |
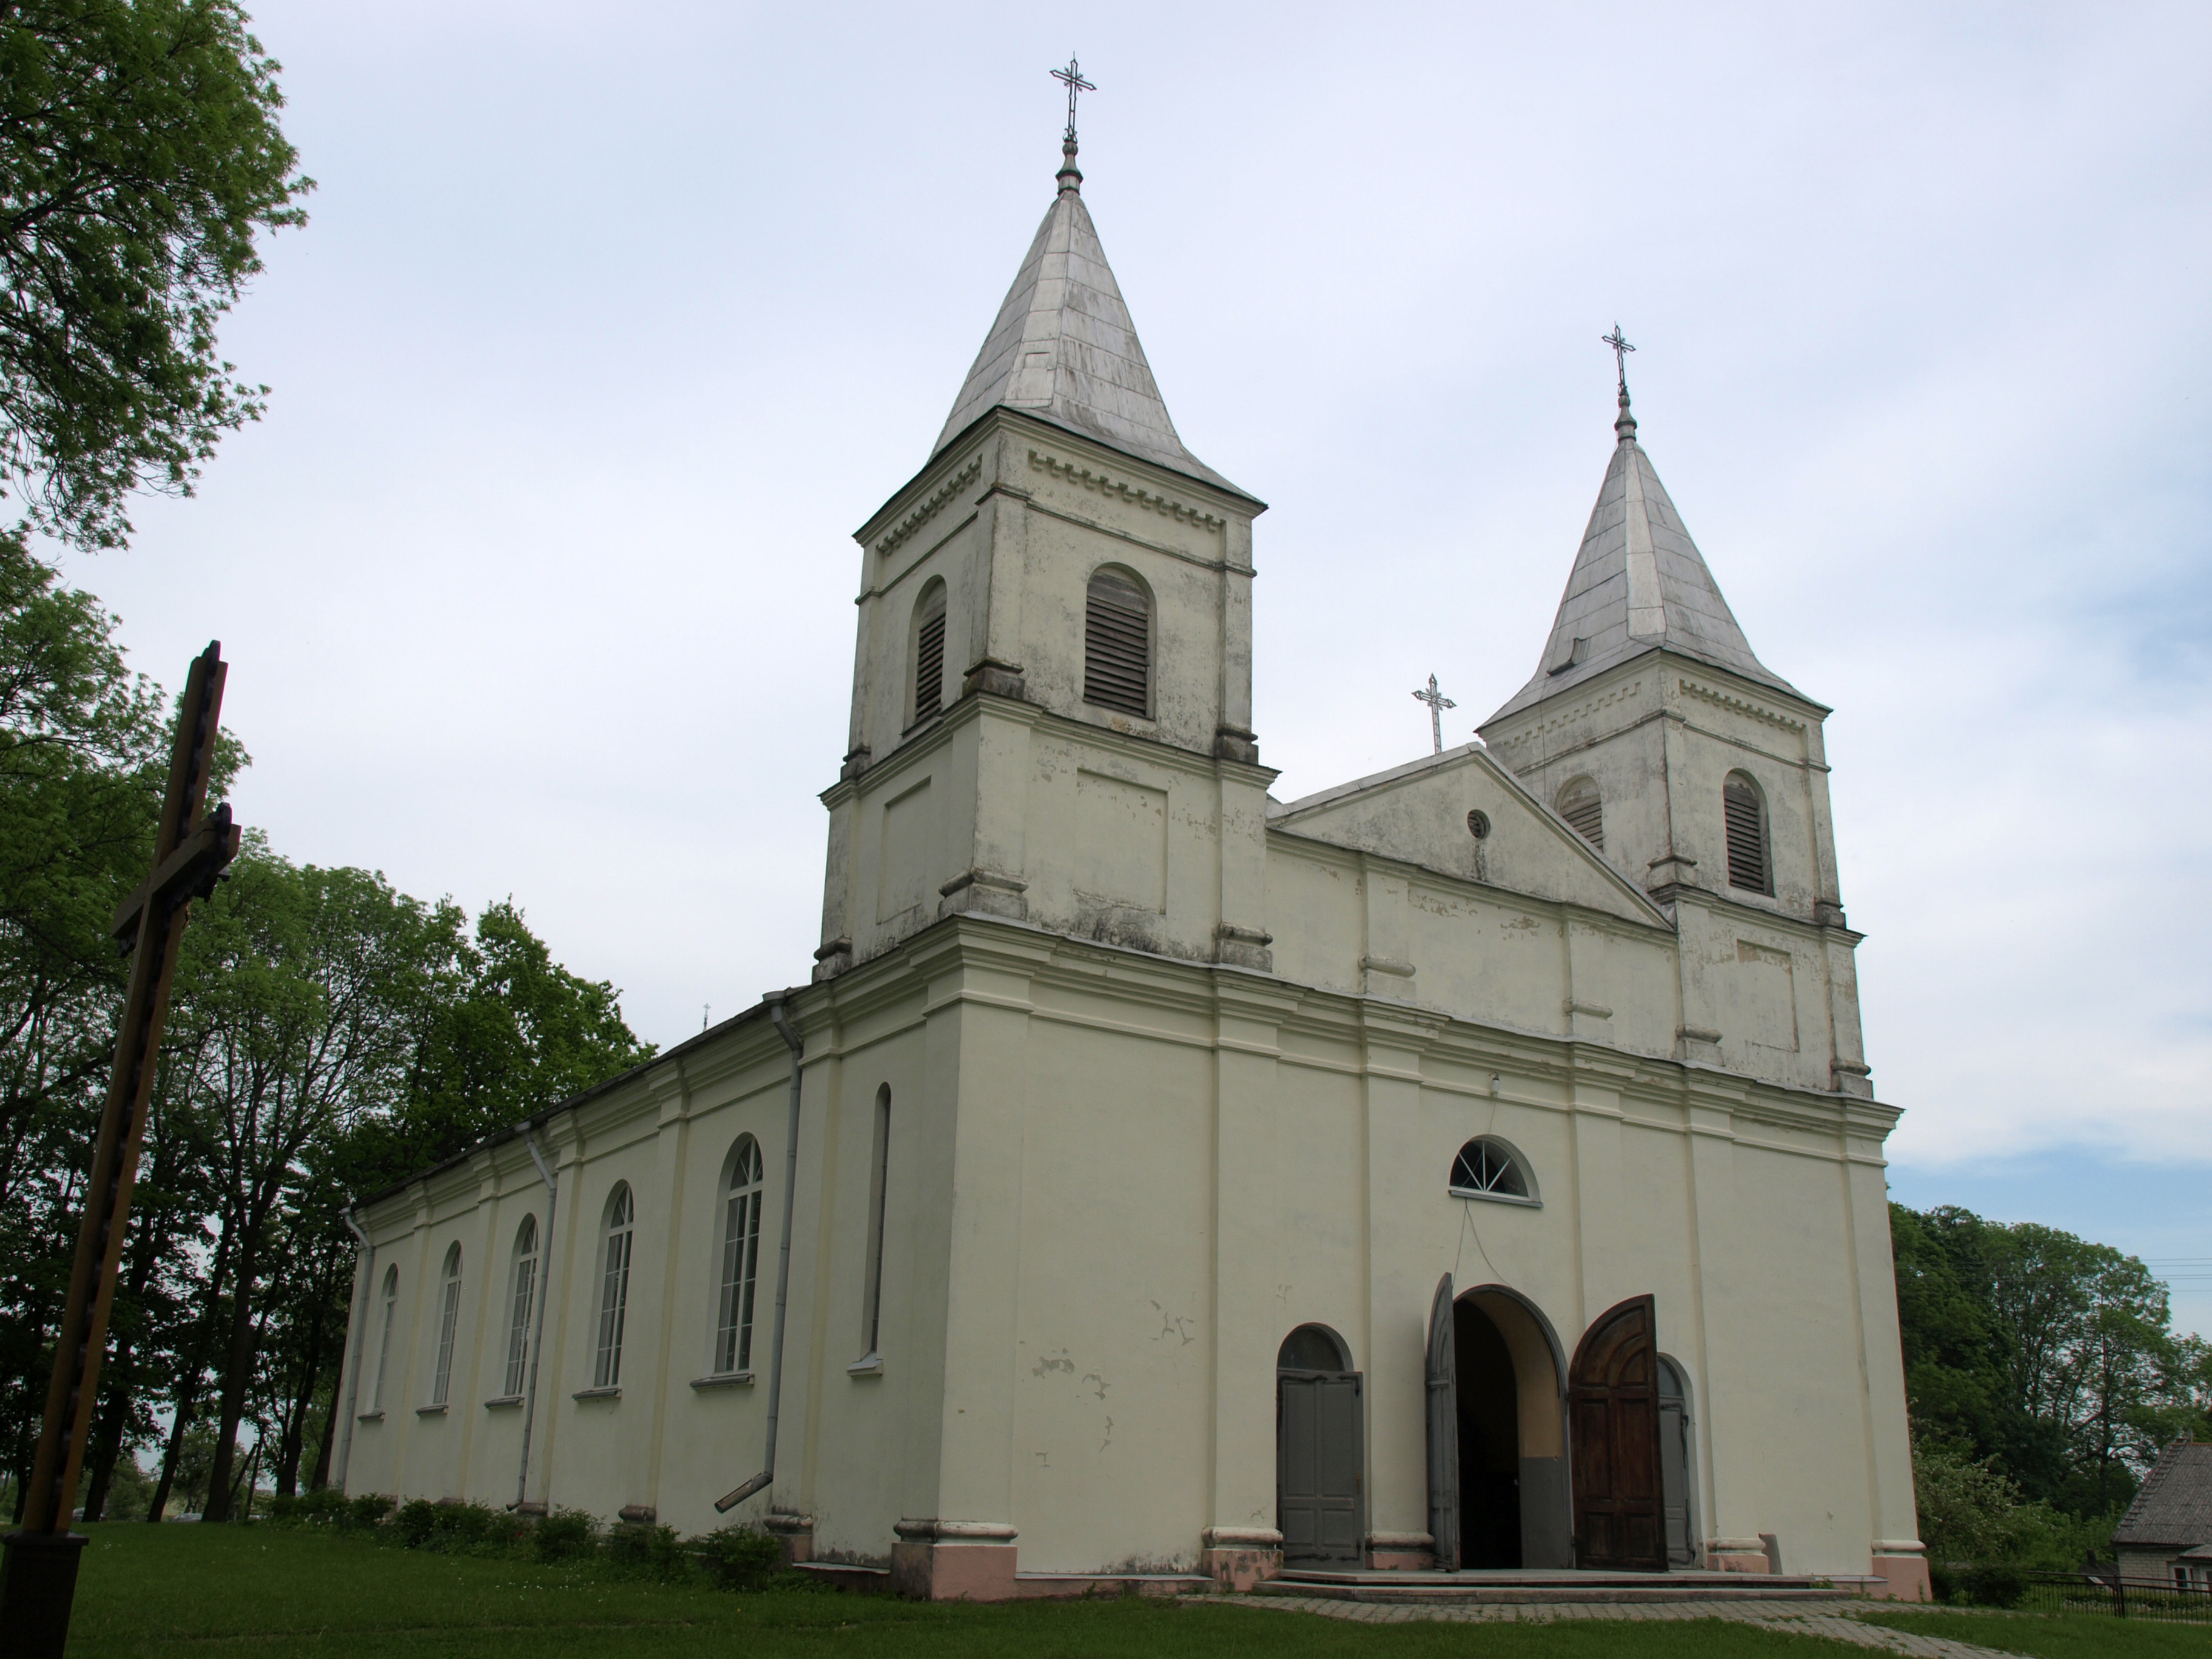
Simnas
Simnas ( pronunciation ) (Polish: Simno) is a city within the Alytus district municipality, Lithuania. It is located 23 km (14 mi) west of Alytus.
Simnas Wikipedia Page


About Our Data
The data on this page is estimated using a number of publicly available tools and resources. It is provided without warranty, and could contain inaccuracies. Use at your own risk.