Categories in Vepriai
Vepriai Facts
| Area | 47.4 km² |
| Population | 26,780 |
| Male Population | 12,191 (45.5%) |
| Female Population | 14,589 (54.5%) |
| Population change (1975 to 2020) | +152.7% |
| Population change (2000 to 2020) | +7.1% |
| Median Age | 36.7 years (Male: 34.3, Female: 38.9) |
| Neighborhoods | Vepriai |
| Local Time | |
| Timezone | Eastern European Summer Time |
| Lat & Lng | 55.15000, 24.56667 |
| Postal Codes | 20265, 20267, 20268, 20276, 20277, More |
Map of Vepriai
Interactive Map
Vepriai Population
Years 1975 to 2020
| Data | 1975 | 1990 | 2000 | 2015 | 2020 |
|---|---|---|---|---|---|
| Population | 10,596 | 18,189 | 25,014 | 26,987 | 26,780 |
| Population Density | 223.7 / km² | 383.9 / km² | 528 / km² | 569.6 / km² | 565.3 / km² |
Vepriai Population change from 2000 to 2015
Increase of 7.9% from year 2000 to 2015
| Location | Change since 1975 | Change since 1990 | Change since 2000 |
|---|---|---|---|
| Vepriai | +154.7% | +48.4% | +7.9% |
| Lithuania | -12.8% | -22.2% | -17.4% |
Vepriai Median Age
Median Age: 36.7 years
| Location | Median Age | Median Age (Female) | Median Age (Male) |
|---|---|---|---|
| Vepriai | 36.7 yrs | 38.9 yrs | 34.3 yrs |
| Lithuania | 39.7 yrs | 42.1 yrs | 37 yrs |
Vepriai Population Density
Population Density: 565 / km²
| Location | Population | Area | Density |
|---|---|---|---|
| Vepriai | 26,780 | 47.4 km² | 565 / km² |
| Lithuania | 2.9 million | 65,263.1 km² | 44.1 / km² |
Vepriai Historical and Projected Population
Estimated Population from 1720 to 2100
- JRC (European Commission's Joint Research Centre) work on the GHS built-up grid
- CIESIN (Center for International Earth Science Information Network)
- [Link] Klein Goldewijk, K., Beusen, A., Doelman, J., and Stehfest, E.: Anthropogenic land use estimates for the Holocene – HYDE 3.2, Earth Syst. Sci. Data, 9, 927–953, https://doi.org/10.5194/essd-9-927-2017, 2017.
Postal Codes
Percentage of businesses by Postal Codes in Vepriai
Human Development Index (HDI)
Statistic composite index of life expectancy, education, and per capita income.
Vepriai CO2 Emissions
Carbon Dioxide (CO2) Emissions Per Capita in Tonnes Per Year
| Location | CO2 Emissions | CO2 Emissions Per Capita | CO2 Emissions Intensity |
|---|---|---|---|
| Vepriai | 242,387 tn | 9.05 tn | 5,116.3 tons/km² |
| Lithuania | 23,559,934 tn | 8.18 tn | 361 tons/km² |
| 2013 CO2 emissions (tonnes/year) | 242,387 tn |
| 2013 CO2 emissions (tonnes/year) per capita | 9.05 tn |
| 2013 CO2 emissions intensity (tonnes/km²/year) | 5,116.3 tons/km² |
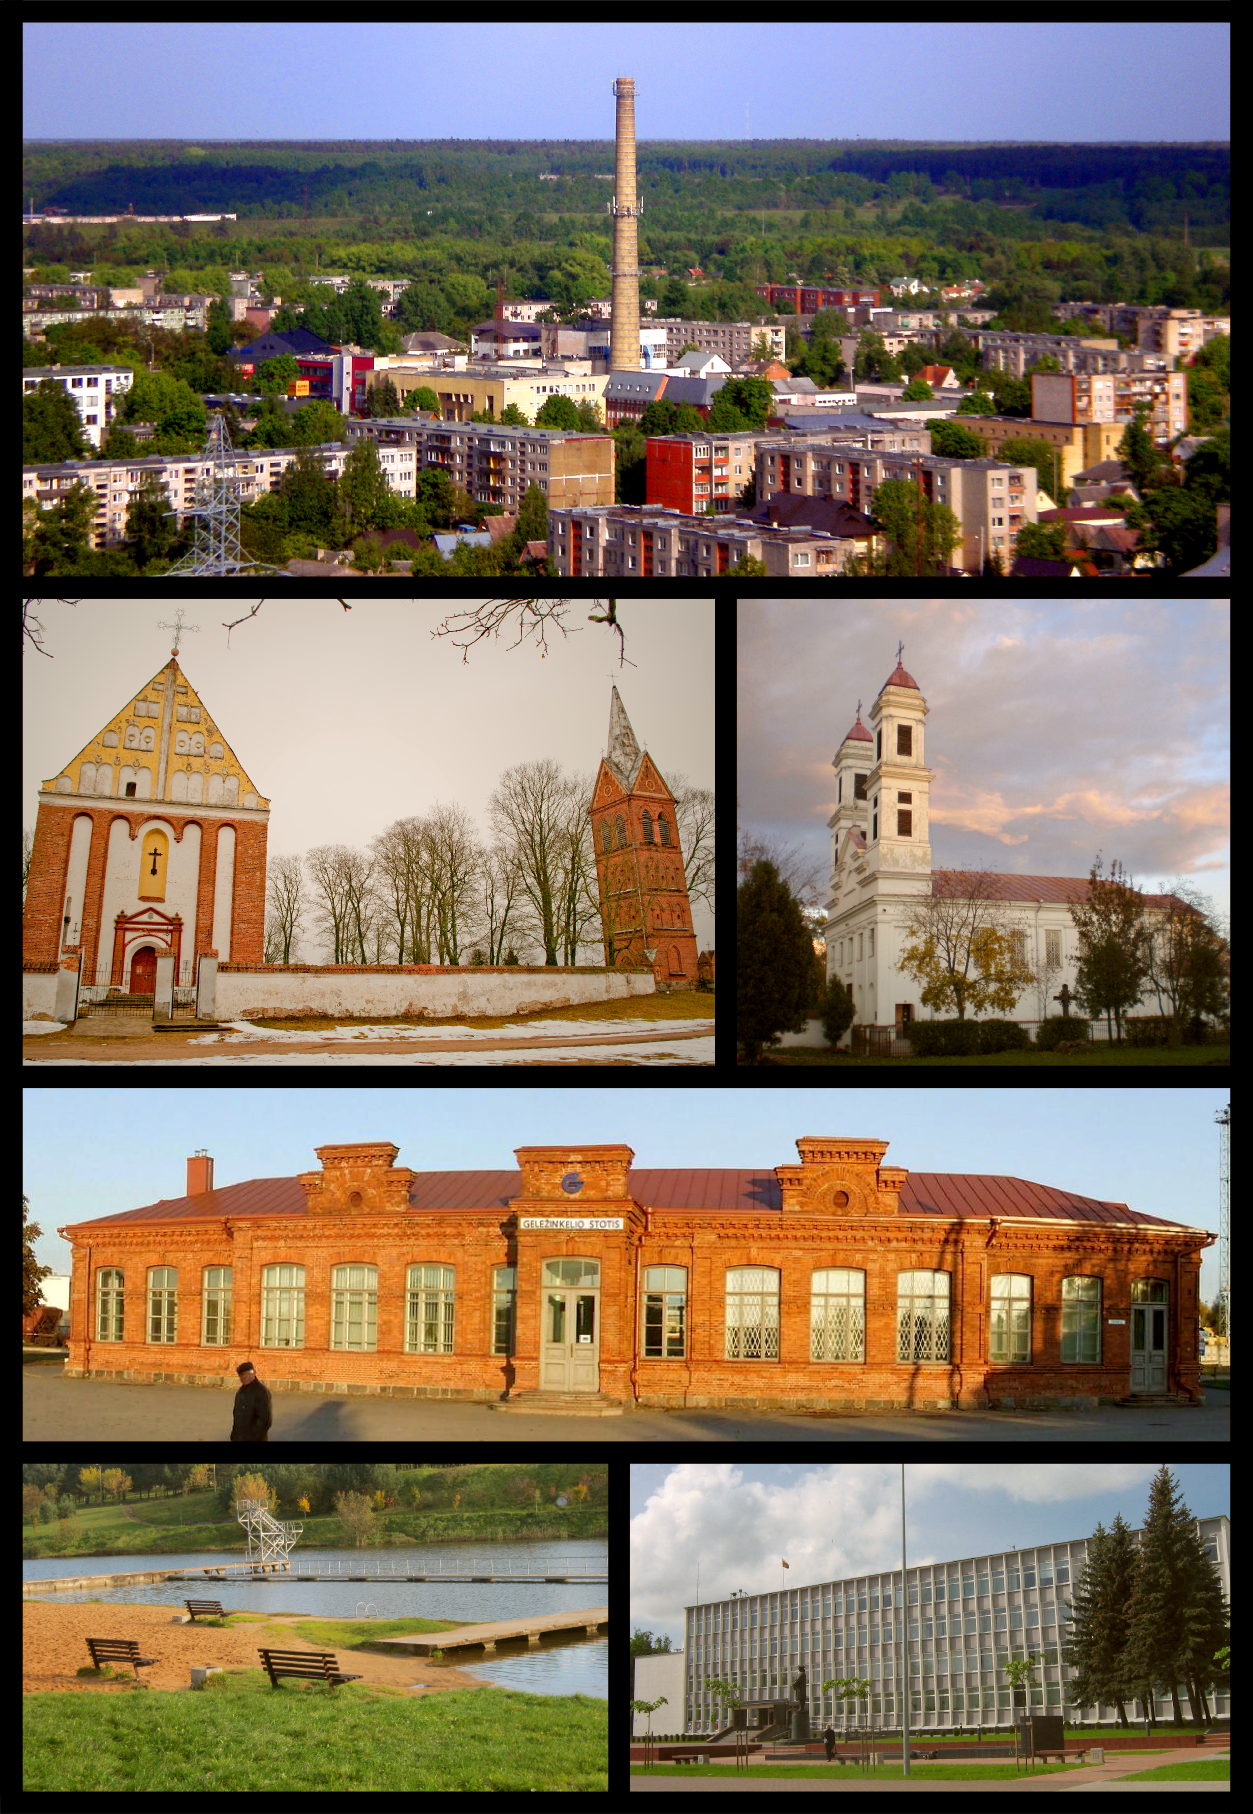
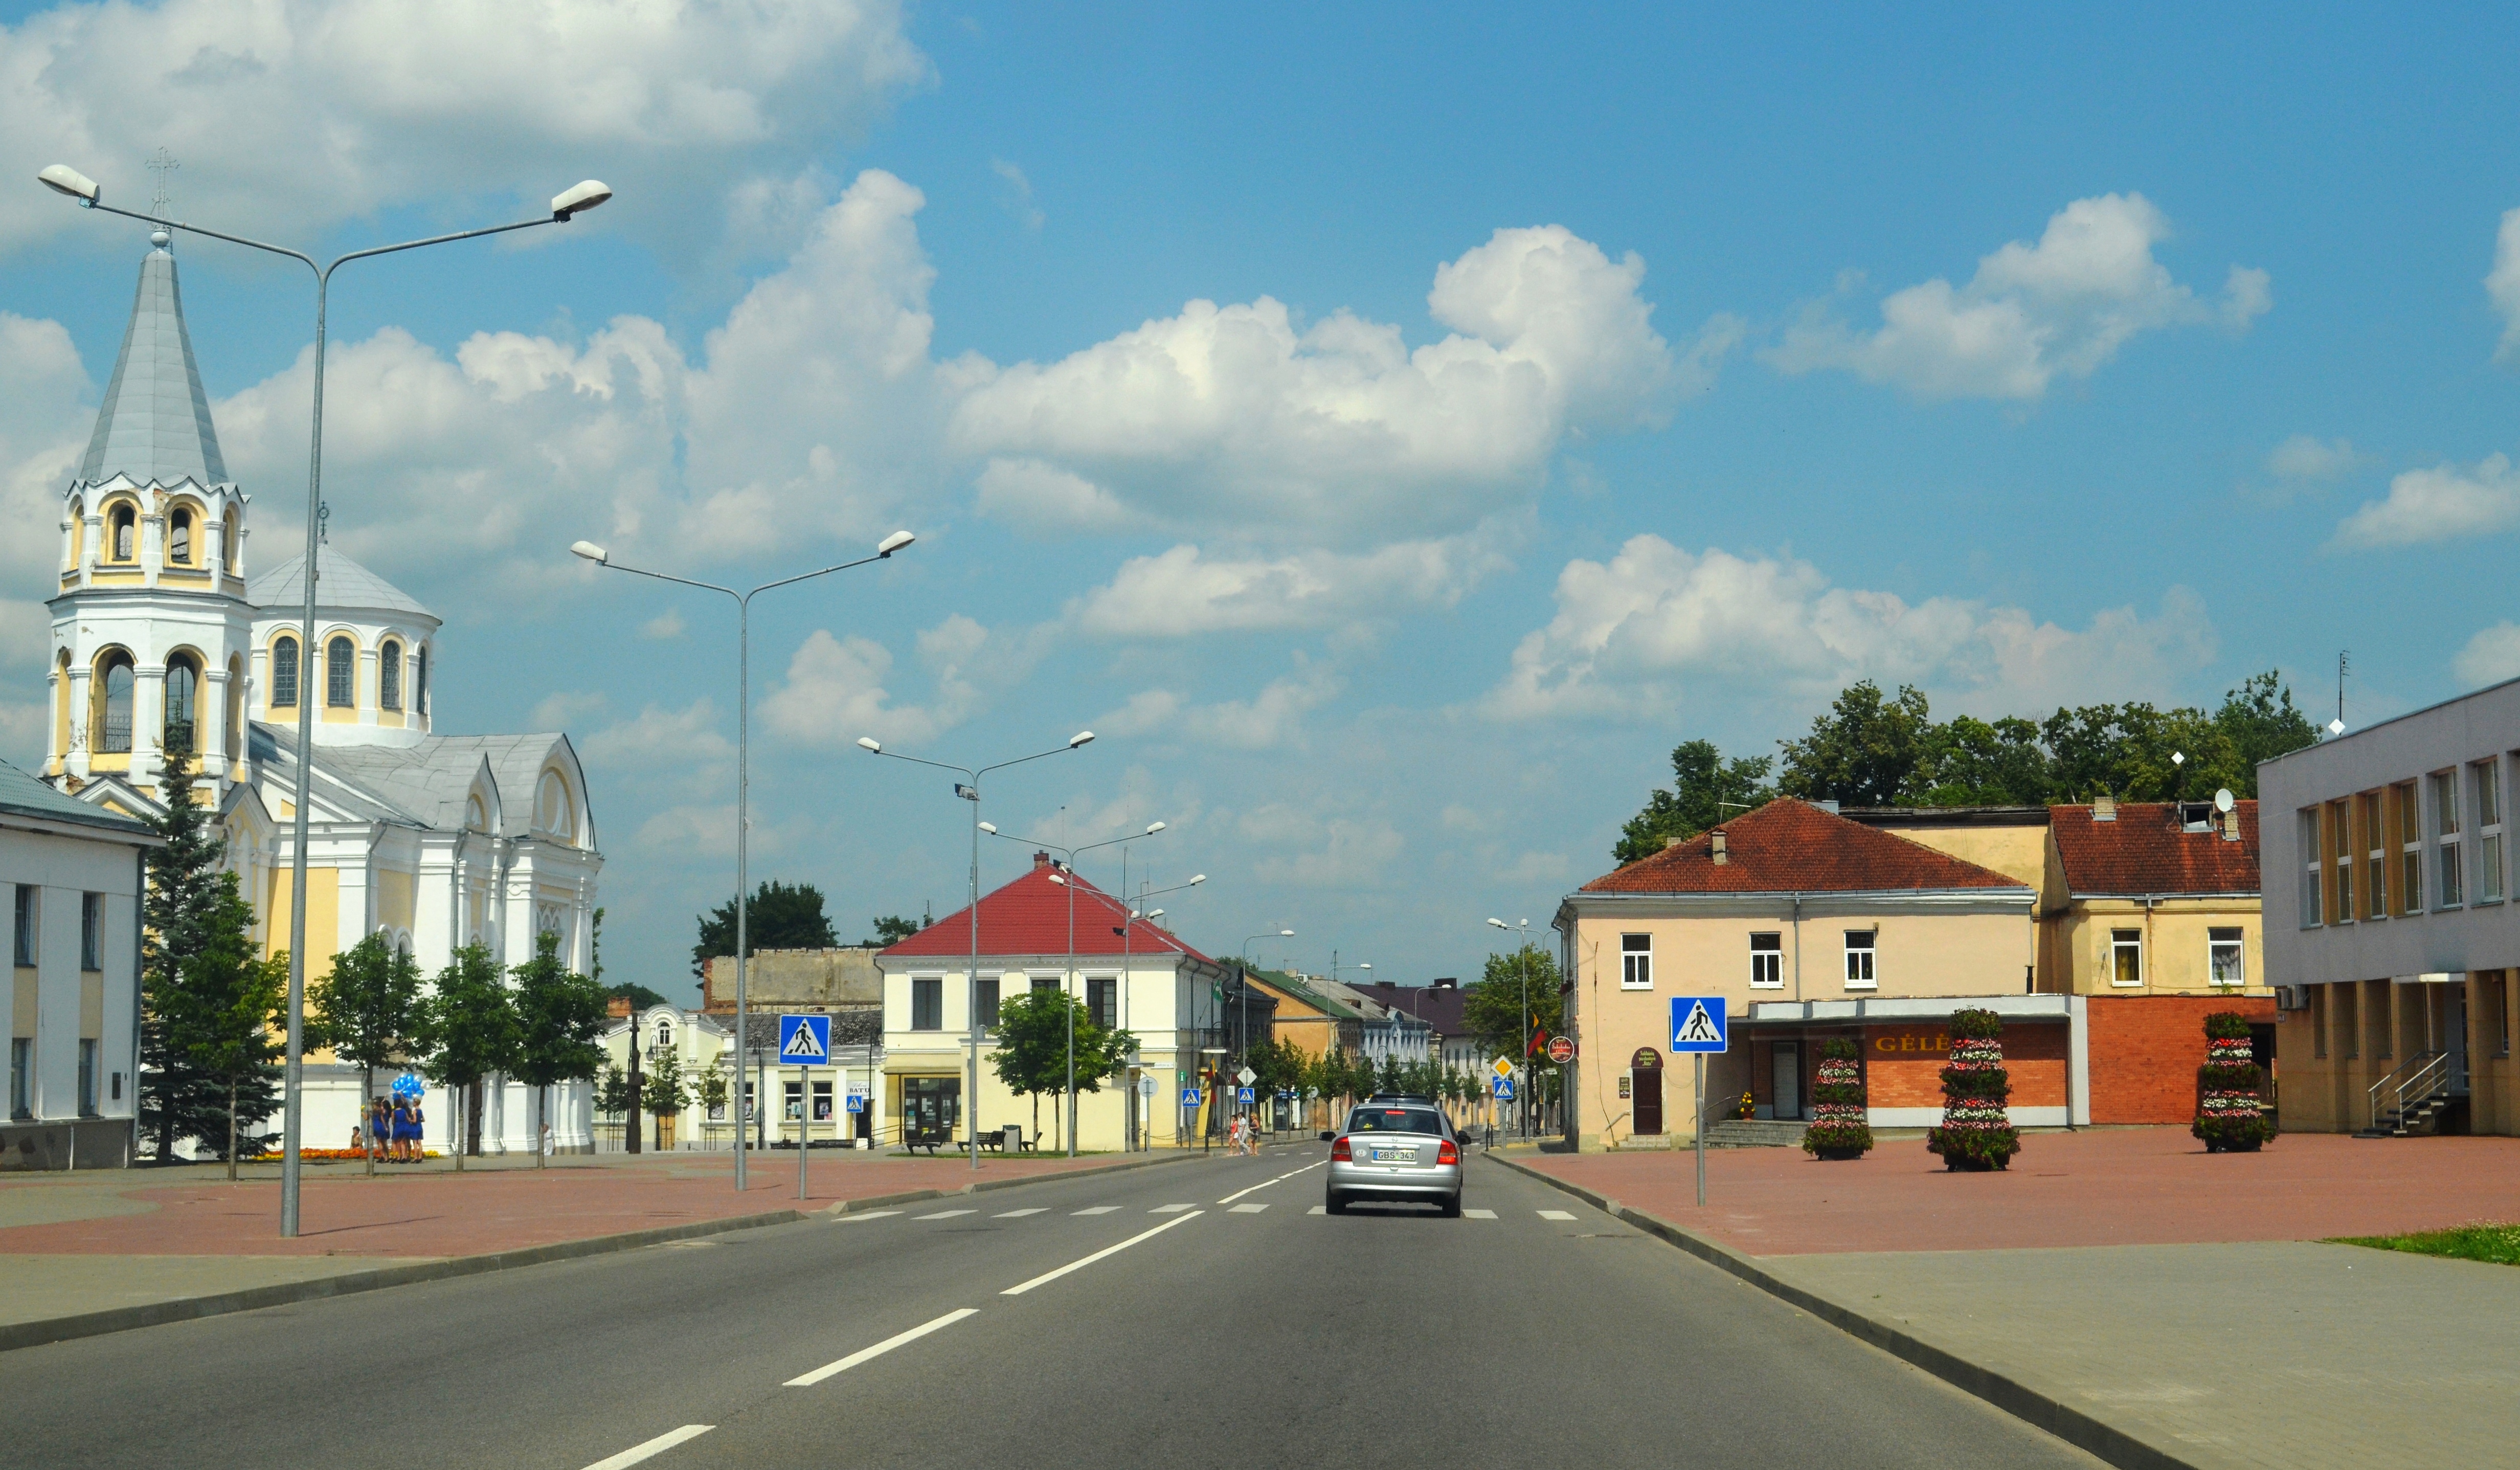
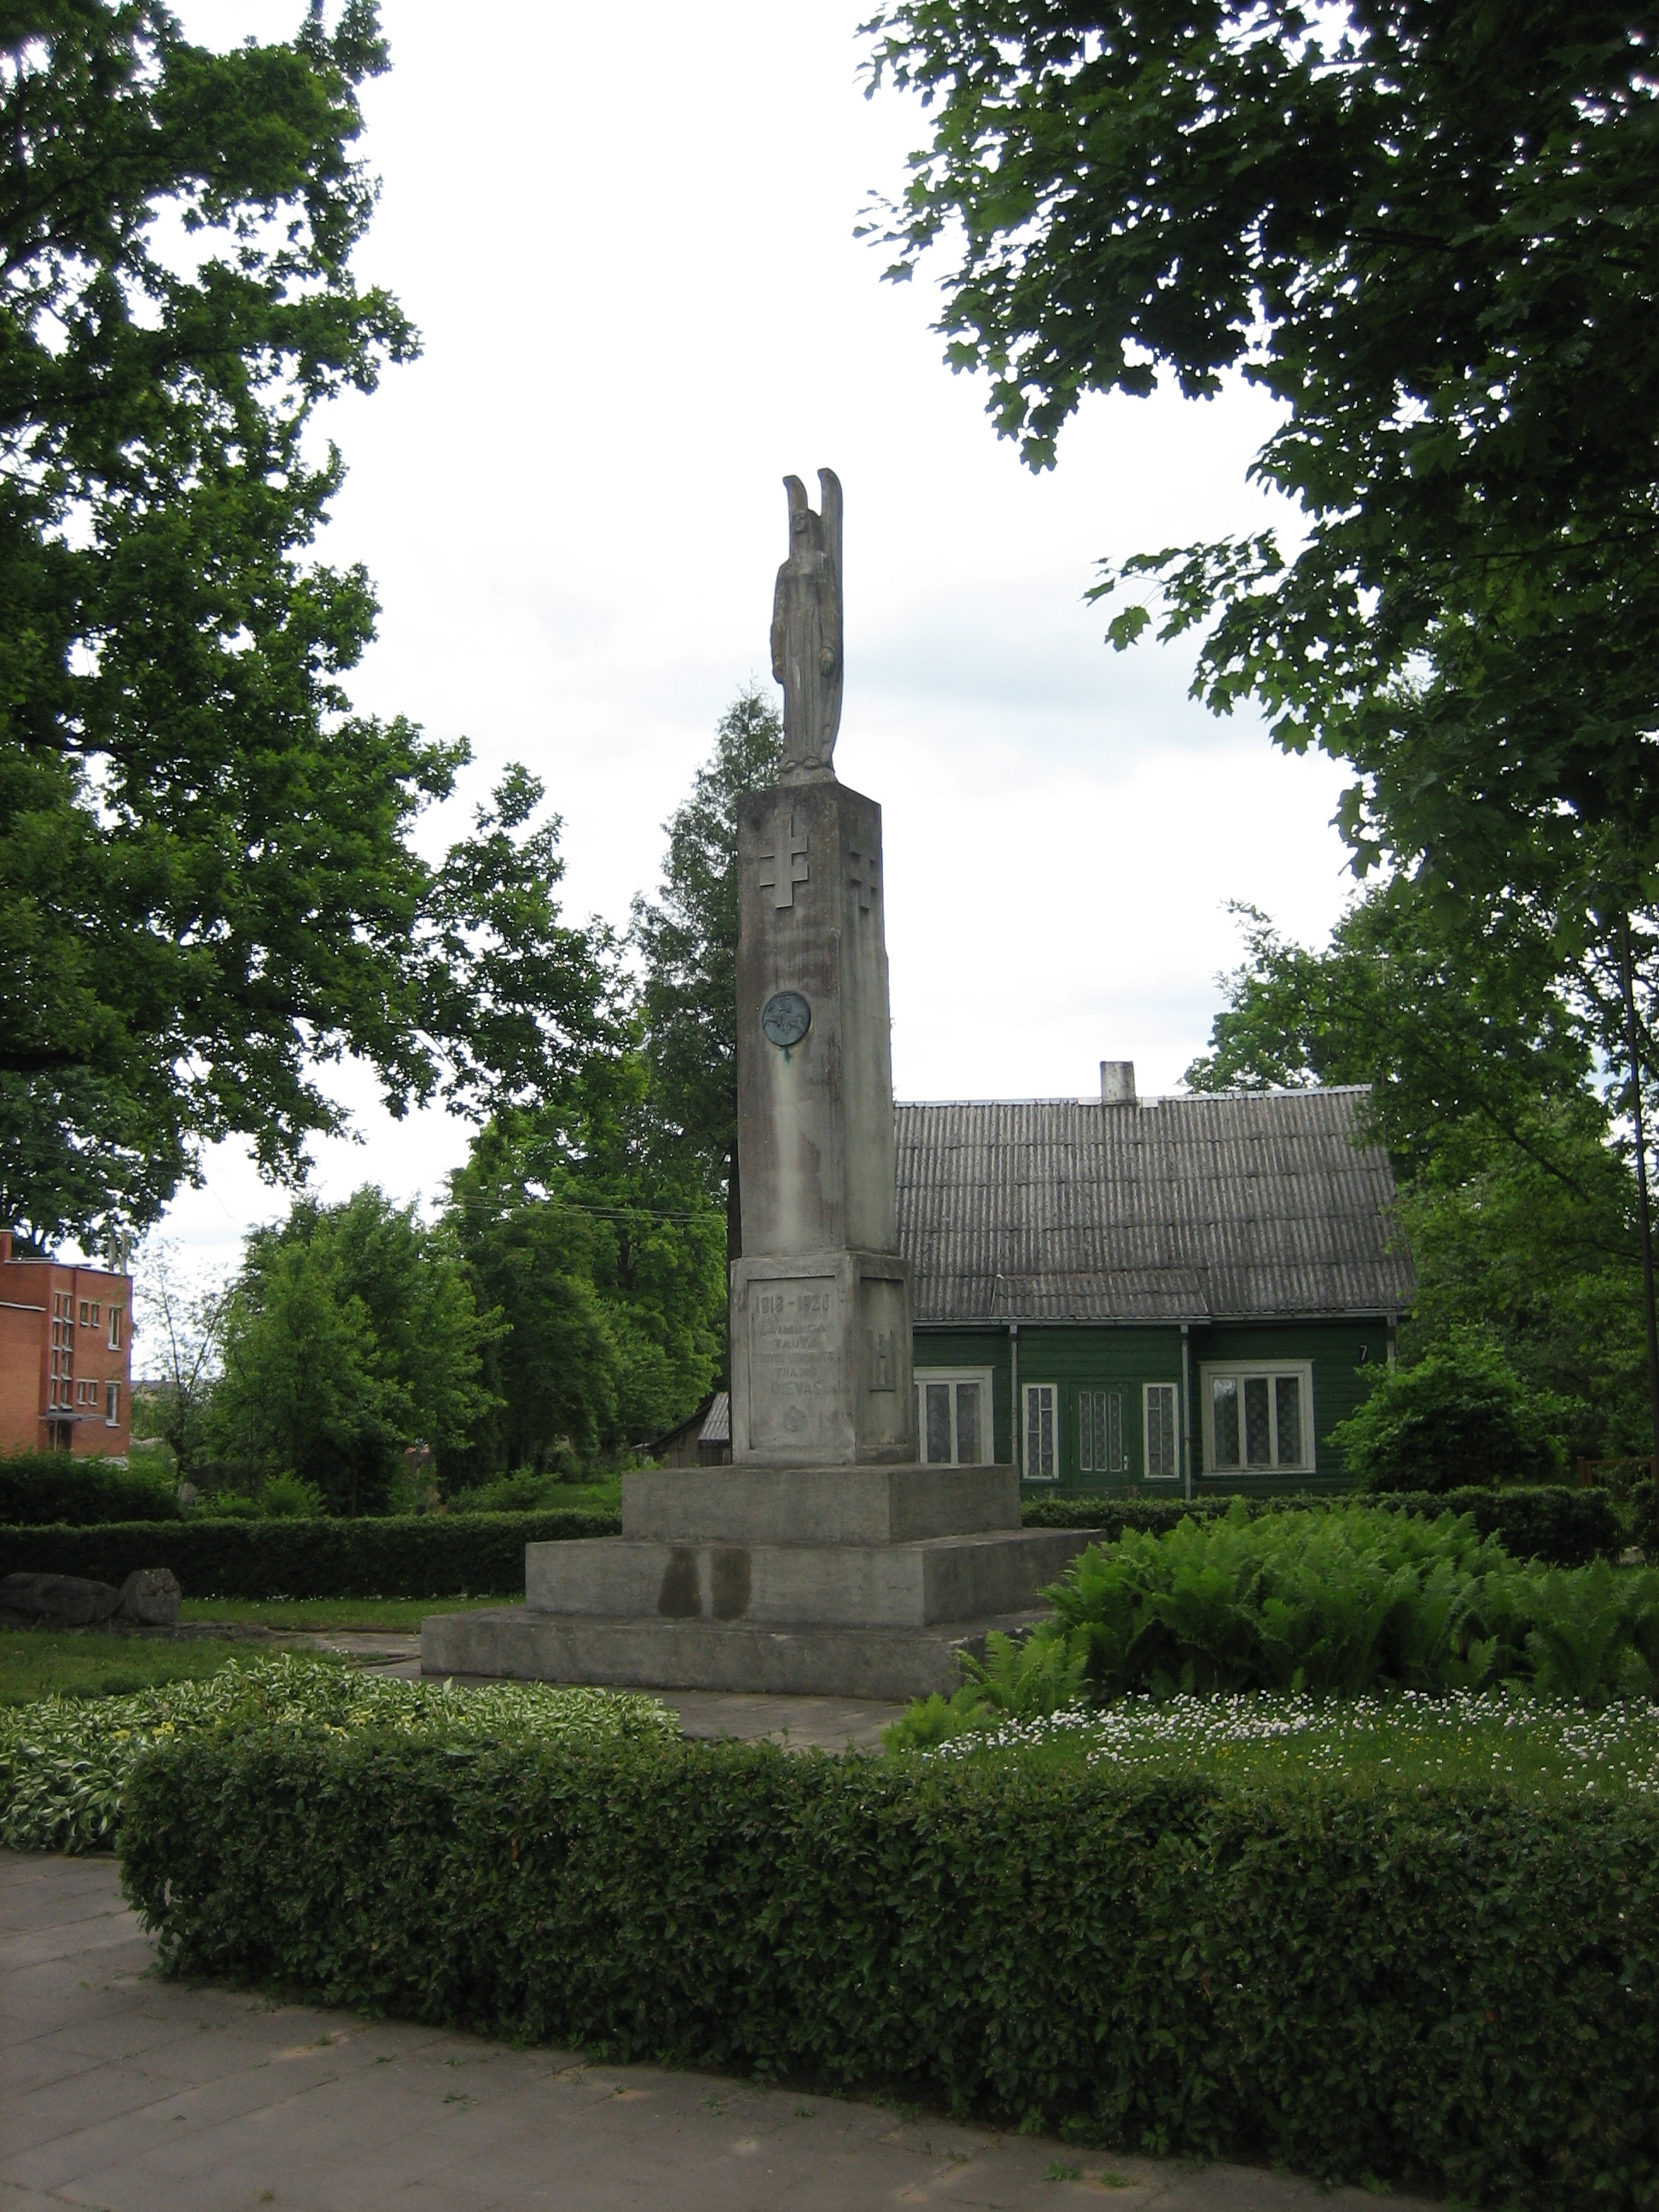
Vepriai
Vepriai (/ˈvæpreɪ/; simplified Lithuanian transcription [væpriaǐ]) (Polish: Wieprze) is the largest town in Ukmergė district, Lithuania, situated south-west of Ukmergė with population of about 549 (2011). The capital of Vepriai elderate.
Vepriai Wikipedia Page
About Our Data
The data on this page is estimated using a number of publicly available tools and resources. It is provided without warranty, and could contain inaccuracies. Use at your own risk.