Categories in Šakiai
Industries
Business Distribution by Industry in Šakiai
| Industry Description | Number of Establishments | Average Google Rating |
|---|---|---|
| Shopping | 34 | 3.9 |
| Department stores | 13 | 3.9 |
| Pharmacies and drug stores | 8 | 4.1 |
| Education | 8 | 4.6 |
| Technical construction services | 7 | 4.2 |
| Gas station | 6 | 4.3 |
| Dentists | 6 | 5 |
| Banks | 6 | 4.1 |
| Shopping other | 5 | — |
| Research, development and testing services | 5 | — |
Šakiai Facts
| Area | 5.8 km² |
| Population | 6,709 |
| Male Population | 3,236 (48.2%) |
| Female Population | 3,473 (51.8%) |
| Population change (1975 to 2020) | -56.4% |
| Population change (2000 to 2020) | -40.9% |
| Median Age | 40.5 years (Male: 37.9, Female: 42.7) |
| Area Codes | 345 |
| Neighborhoods | Kudirkos Naumiestis |
| Local Time | |
| Timezone | Eastern European Summer Time |
| Lat & Lng | 54.95472, 23.03583 |
| Postal Codes | 71001, 71101, 71102, 71103, 71104, More |
Map of Šakiai
Interactive Map
Šakiai Population
Years 1975 to 2020
| Data | 1975 | 1990 | 2000 | 2015 | 2020 |
|---|---|---|---|---|---|
| Population | 15,405 | 14,904 | 11,359 | 7,087 | 6,709 |
| Population Density | 2,679.1 / km² | 2,592 / km² | 1,975.5 / km² | 1,232.5 / km² | 1,166.8 / km² |
Šakiai Population change from 2000 to 2015
Decrease of 37.6% from year 2000 to 2015
| Location | Change since 1975 | Change since 1990 | Change since 2000 |
|---|---|---|---|
| Šakiai | -54% | -52.4% | -37.6% |
| Lithuania | -12.8% | -22.2% | -17.4% |
Šakiai Median Age
Median Age: 40.5 years
| Location | Median Age | Median Age (Female) | Median Age (Male) |
|---|---|---|---|
| Šakiai | 40.5 yrs | 42.7 yrs | 37.9 yrs |
| Lithuania | 39.7 yrs | 42.1 yrs | 37 yrs |
Šakiai Population Density
Population Density: 1,167 / km²
| Location | Population | Area | Density |
|---|---|---|---|
| Šakiai | 6,709 | 5.8 km² | 1,167 / km² |
| Lithuania | 2.9 million | 65,263.1 km² | 44.1 / km² |
Šakiai Historical and Projected Population
Estimated Population from 1000 to 2100
- JRC (European Commission's Joint Research Centre) work on the GHS built-up grid
- CIESIN (Center for International Earth Science Information Network)
- [Link] Klein Goldewijk, K., Beusen, A., Doelman, J., and Stehfest, E.: Anthropogenic land use estimates for the Holocene – HYDE 3.2, Earth Syst. Sci. Data, 9, 927–953, https://doi.org/10.5194/essd-9-927-2017, 2017.
Area Codes
Percentage Area Codes used by businesses in Šakiai
Postal Codes
Percentage of businesses by Postal Codes in Šakiai
Price Distribution
Business distribution by price for Šakiai
Human Development Index (HDI)
Statistic composite index of life expectancy, education, and per capita income.
Šakiai CO2 Emissions
Carbon Dioxide (CO2) Emissions Per Capita in Tonnes Per Year
| Location | CO2 Emissions | CO2 Emissions Per Capita | CO2 Emissions Intensity |
|---|---|---|---|
| Šakiai | 52,169 tn | 7.78 tn | 9,072.9 tons/km² |
| Lithuania | 23,559,934 tn | 8.18 tn | 361 tons/km² |
| 2013 CO2 emissions (tonnes/year) | 52,169 tn |
| 2013 CO2 emissions (tonnes/year) per capita | 7.78 tn |
| 2013 CO2 emissions intensity (tonnes/km²/year) | 9,072.9 tons/km² |
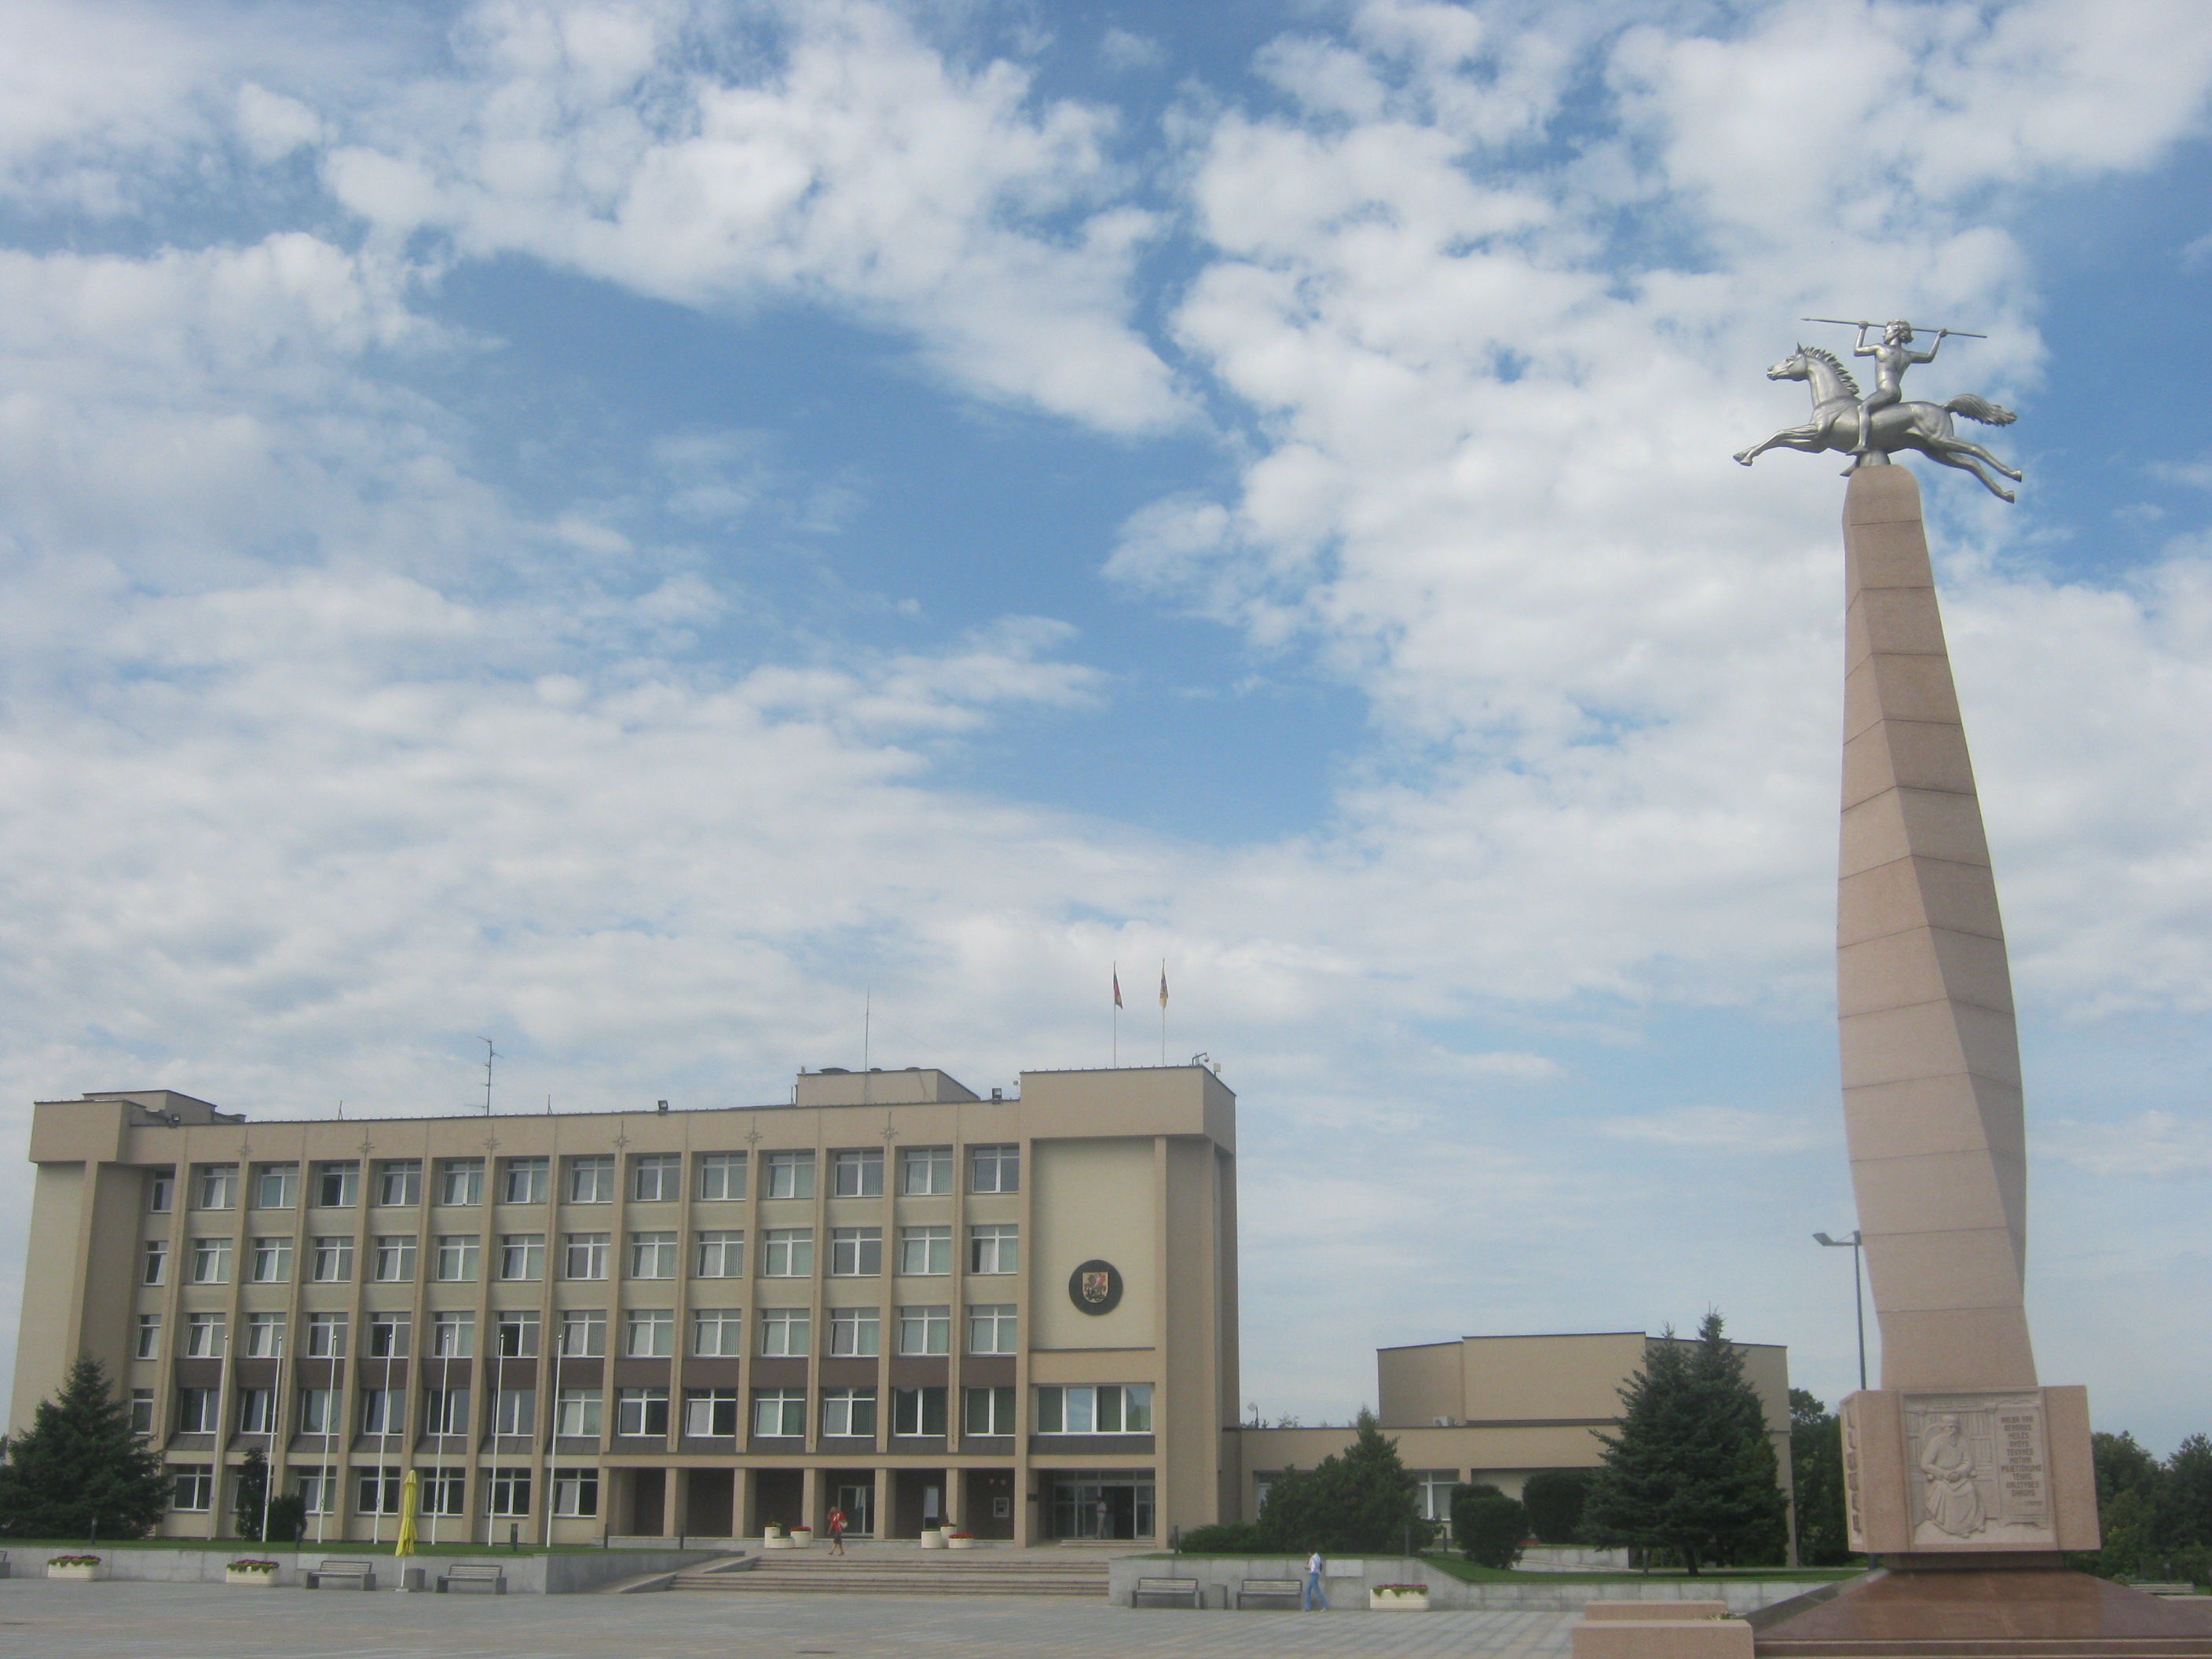
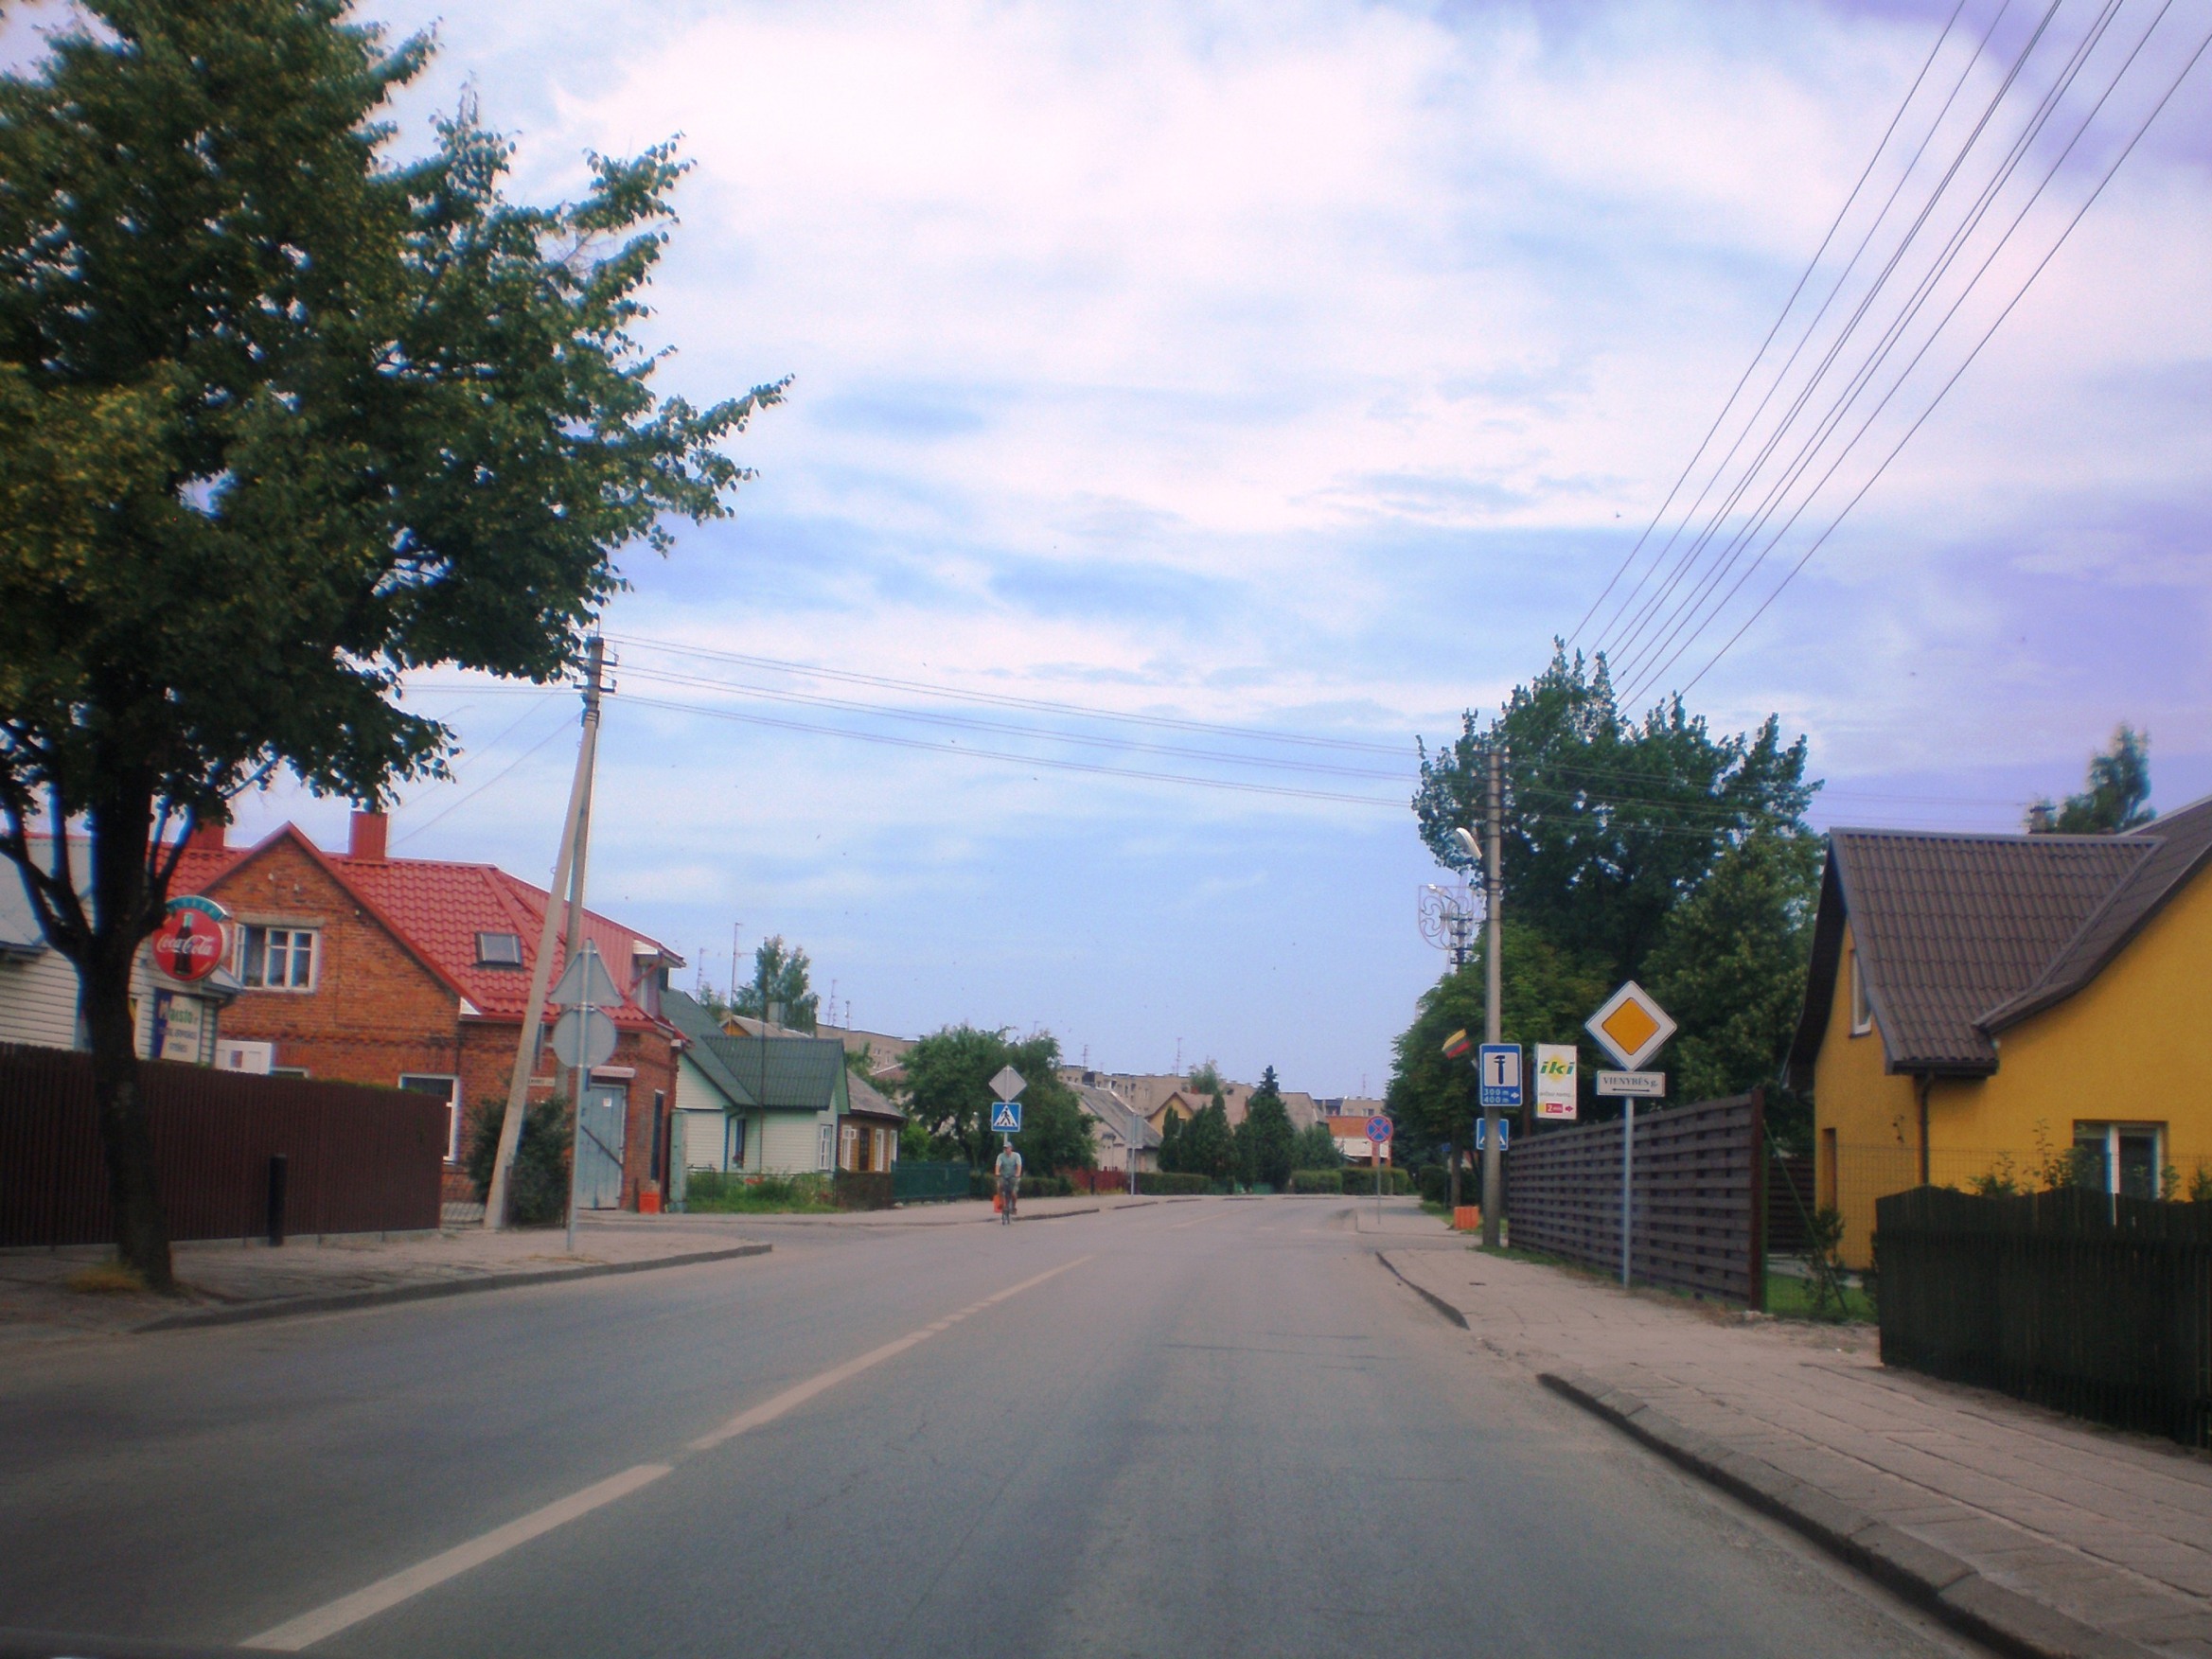
Šakiai
Šakiai ( pronunciation ) is a city in the Marijampolė County, Lithuania. It is located 65 km (40 mi) west of Kaunas. It is presumed that Šakiai first expanded from Šakaičai village. By 1719 a church in Šakiai was built. By the 19th century Šakiai alr..
Šakiai Wikipedia Page

About Our Data
The data on this page is estimated using a number of publicly available tools and resources. It is provided without warranty, and could contain inaccuracies. Use at your own risk.