Oberfeulen Facts
| Area | 28.8 km² |
| Population | 1,910 |
| Male Population | 964 (50.5%) |
| Female Population | 946 (49.5%) |
| Population change (1975 to 2020) | +75.1% |
| Population change (2000 to 2020) | +38.7% |
| Median Age | 38.2 years (Male: 38.4, Female: 38) |
| Local Time | |
| Timezone | Central European Summer Time |
| Lat & Lng | 49.84806, 6.03556 |
| Postal Codes | 9179, 9180 |
Map of Oberfeulen
Interactive Map
Oberfeulen Population
Years 1975 to 2020
| Data | 1975 | 1990 | 2000 | 2015 | 2020 |
|---|---|---|---|---|---|
| Population | 1,091 | 1,203 | 1,377 | 1,778 | 1,910 |
| Population Density | 37.9 / km² | 41.8 / km² | 47.8 / km² | 61.7 / km² | 66.3 / km² |
Oberfeulen Population change from 2000 to 2015
Increase of 29.1% from year 2000 to 2015
| Location | Change since 1975 | Change since 1990 | Change since 2000 |
|---|---|---|---|
| Oberfeulen | +63% | +47.8% | +29.1% |
| Diekirch District | +57.3% | +46.3% | +28.8% |
| Luxembourg | +59.8% | +48.2% | +29.8% |
Oberfeulen Median Age
Median Age: 38.2 years
| Location | Median Age | Median Age (Female) | Median Age (Male) |
|---|---|---|---|
| Oberfeulen | 38.2 yrs | 38 yrs | 38.4 yrs |
| Diekirch District | 38.6 yrs | 39.1 yrs | 38.1 yrs |
| Luxembourg | 39.1 yrs | 39.7 yrs | 38.5 yrs |
Oberfeulen Population Density
Population Density: 66.3 / km²
| Location | Population | Area | Density |
|---|---|---|---|
| Oberfeulen | 1,910 | 28.8 km² | 66.3 / km² |
| Diekirch District | 85,588 | 1,147 km² | 74.6 / km² |
| Luxembourg | 568,597 | 2,599.8 km² | 219 / km² |
Oberfeulen Historical and Projected Population
Estimated Population from 0 to 2100
- JRC (European Commission's Joint Research Centre) work on the GHS built-up grid
- CIESIN (Center for International Earth Science Information Network)
- [Link] Klein Goldewijk, K., Beusen, A., Doelman, J., and Stehfest, E.: Anthropogenic land use estimates for the Holocene – HYDE 3.2, Earth Syst. Sci. Data, 9, 927–953, https://doi.org/10.5194/essd-9-927-2017, 2017.
Human Development Index (HDI)
Statistic composite index of life expectancy, education, and per capita income.
Oberfeulen CO2 Emissions
Carbon Dioxide (CO2) Emissions Per Capita in Tonnes Per Year
| Location | CO2 Emissions | CO2 Emissions Per Capita | CO2 Emissions Intensity |
|---|---|---|---|
| Oberfeulen | 62,269 tn | 32.6 tn | 2,161.2 tons/km² |
| Diekirch District | 2,646,877 tn | 30.93 tn | 2,307.7 tons/km² |
| Luxembourg | 17,905,018 tn | 31.49 tn | 6,887.1 tons/km² |
| 2013 CO2 emissions (tonnes/year) | 62,269 tn |
| 2013 CO2 emissions (tonnes/year) per capita | 32.6 tn |
| 2013 CO2 emissions intensity (tonnes/km²/year) | 2,161.2 tons/km² |
Natural Hazards Risk
Relative risk out of 10
| Hazard | Risk Level |
|---|---|
| Flood | High (8) |
| Earthquake | Low (2) |
* Risk, particularly concerning flood or landslide, may not be for the entire area.
- Dilley, M., R.S. Chen, U. Deichmann, A.L. Lerner-Lam, M. Arnold, J. Agwe, P. Buys, O. Kjekstad, B. Lyon, and G. Yetman. 2005. Natural Disaster Hotspots: A Global Risk Analysis. Washington, D.C.: World Bank. https://doi.org/10.1596/0-8213-5930-4.
- Center for Hazards and Risk Research - CHRR - Columbia University, Center for International Earth Science Information Network - CIESIN - Columbia University. 2005. Global Flood Hazard Frequency and Distribution. Palisades, NY: NASA Socioeconomic Data and Applications Center (SEDAC). https://doi.org/10.7927/H4668B3D.
- Center for Hazards and Risk Research - CHRR - Columbia University, Center for International Earth Science Information Network - CIESIN - Columbia University. 2005. Global Earthquake Hazard Distribution - Peak Ground Acceleration. Palisades, NY: NASA Socioeconomic Data and Applications Center (SEDAC). https://doi.org/10.7927/H4BZ63ZS.
Recent Nearby Earthquakes
Magnitude 3.0 and greater
| Date▼ | Time↕ | Magnitude↕ | Distance↕ | Depth↕ | Location↕ | Link |
|---|---|---|---|---|---|---|
| 9/28/08 | 12:02 AM | 3 | 79.3 km | 1,000 m | Germany | usgs.gov |
| 2/23/08 | 3:30 PM | 4.5 | 79.5 km | 2,000 m | Germany | usgs.gov |
| 2/18/08 | 1:28 PM | 3.2 | 79.3 km | 1,000 m | Germany | usgs.gov |
| 2/13/08 | 1:56 PM | 3.3 | 74.1 km | 1,000 m | Germany | usgs.gov |
| 2/9/08 | 8:47 PM | 3.5 | 77.2 km | 1,000 m | Germany | usgs.gov |
| 2/4/08 | 12:44 AM | 3.4 | 78.8 km | 1,000 m | Germany | usgs.gov |
| 1/26/08 | 5:44 AM | 3.9 | 78.3 km | 1,000 m | Germany | usgs.gov |
| 1/26/08 | 4:19 AM | 3.8 | 75.4 km | 1,000 m | Germany | usgs.gov |
| 1/16/08 | 10:42 AM | 3.5 | 75.4 km | 1,000 m | Germany | usgs.gov |
| 1/10/08 | 11:17 AM | 3.5 | 78.8 km | 1,000 m | Germany | usgs.gov |
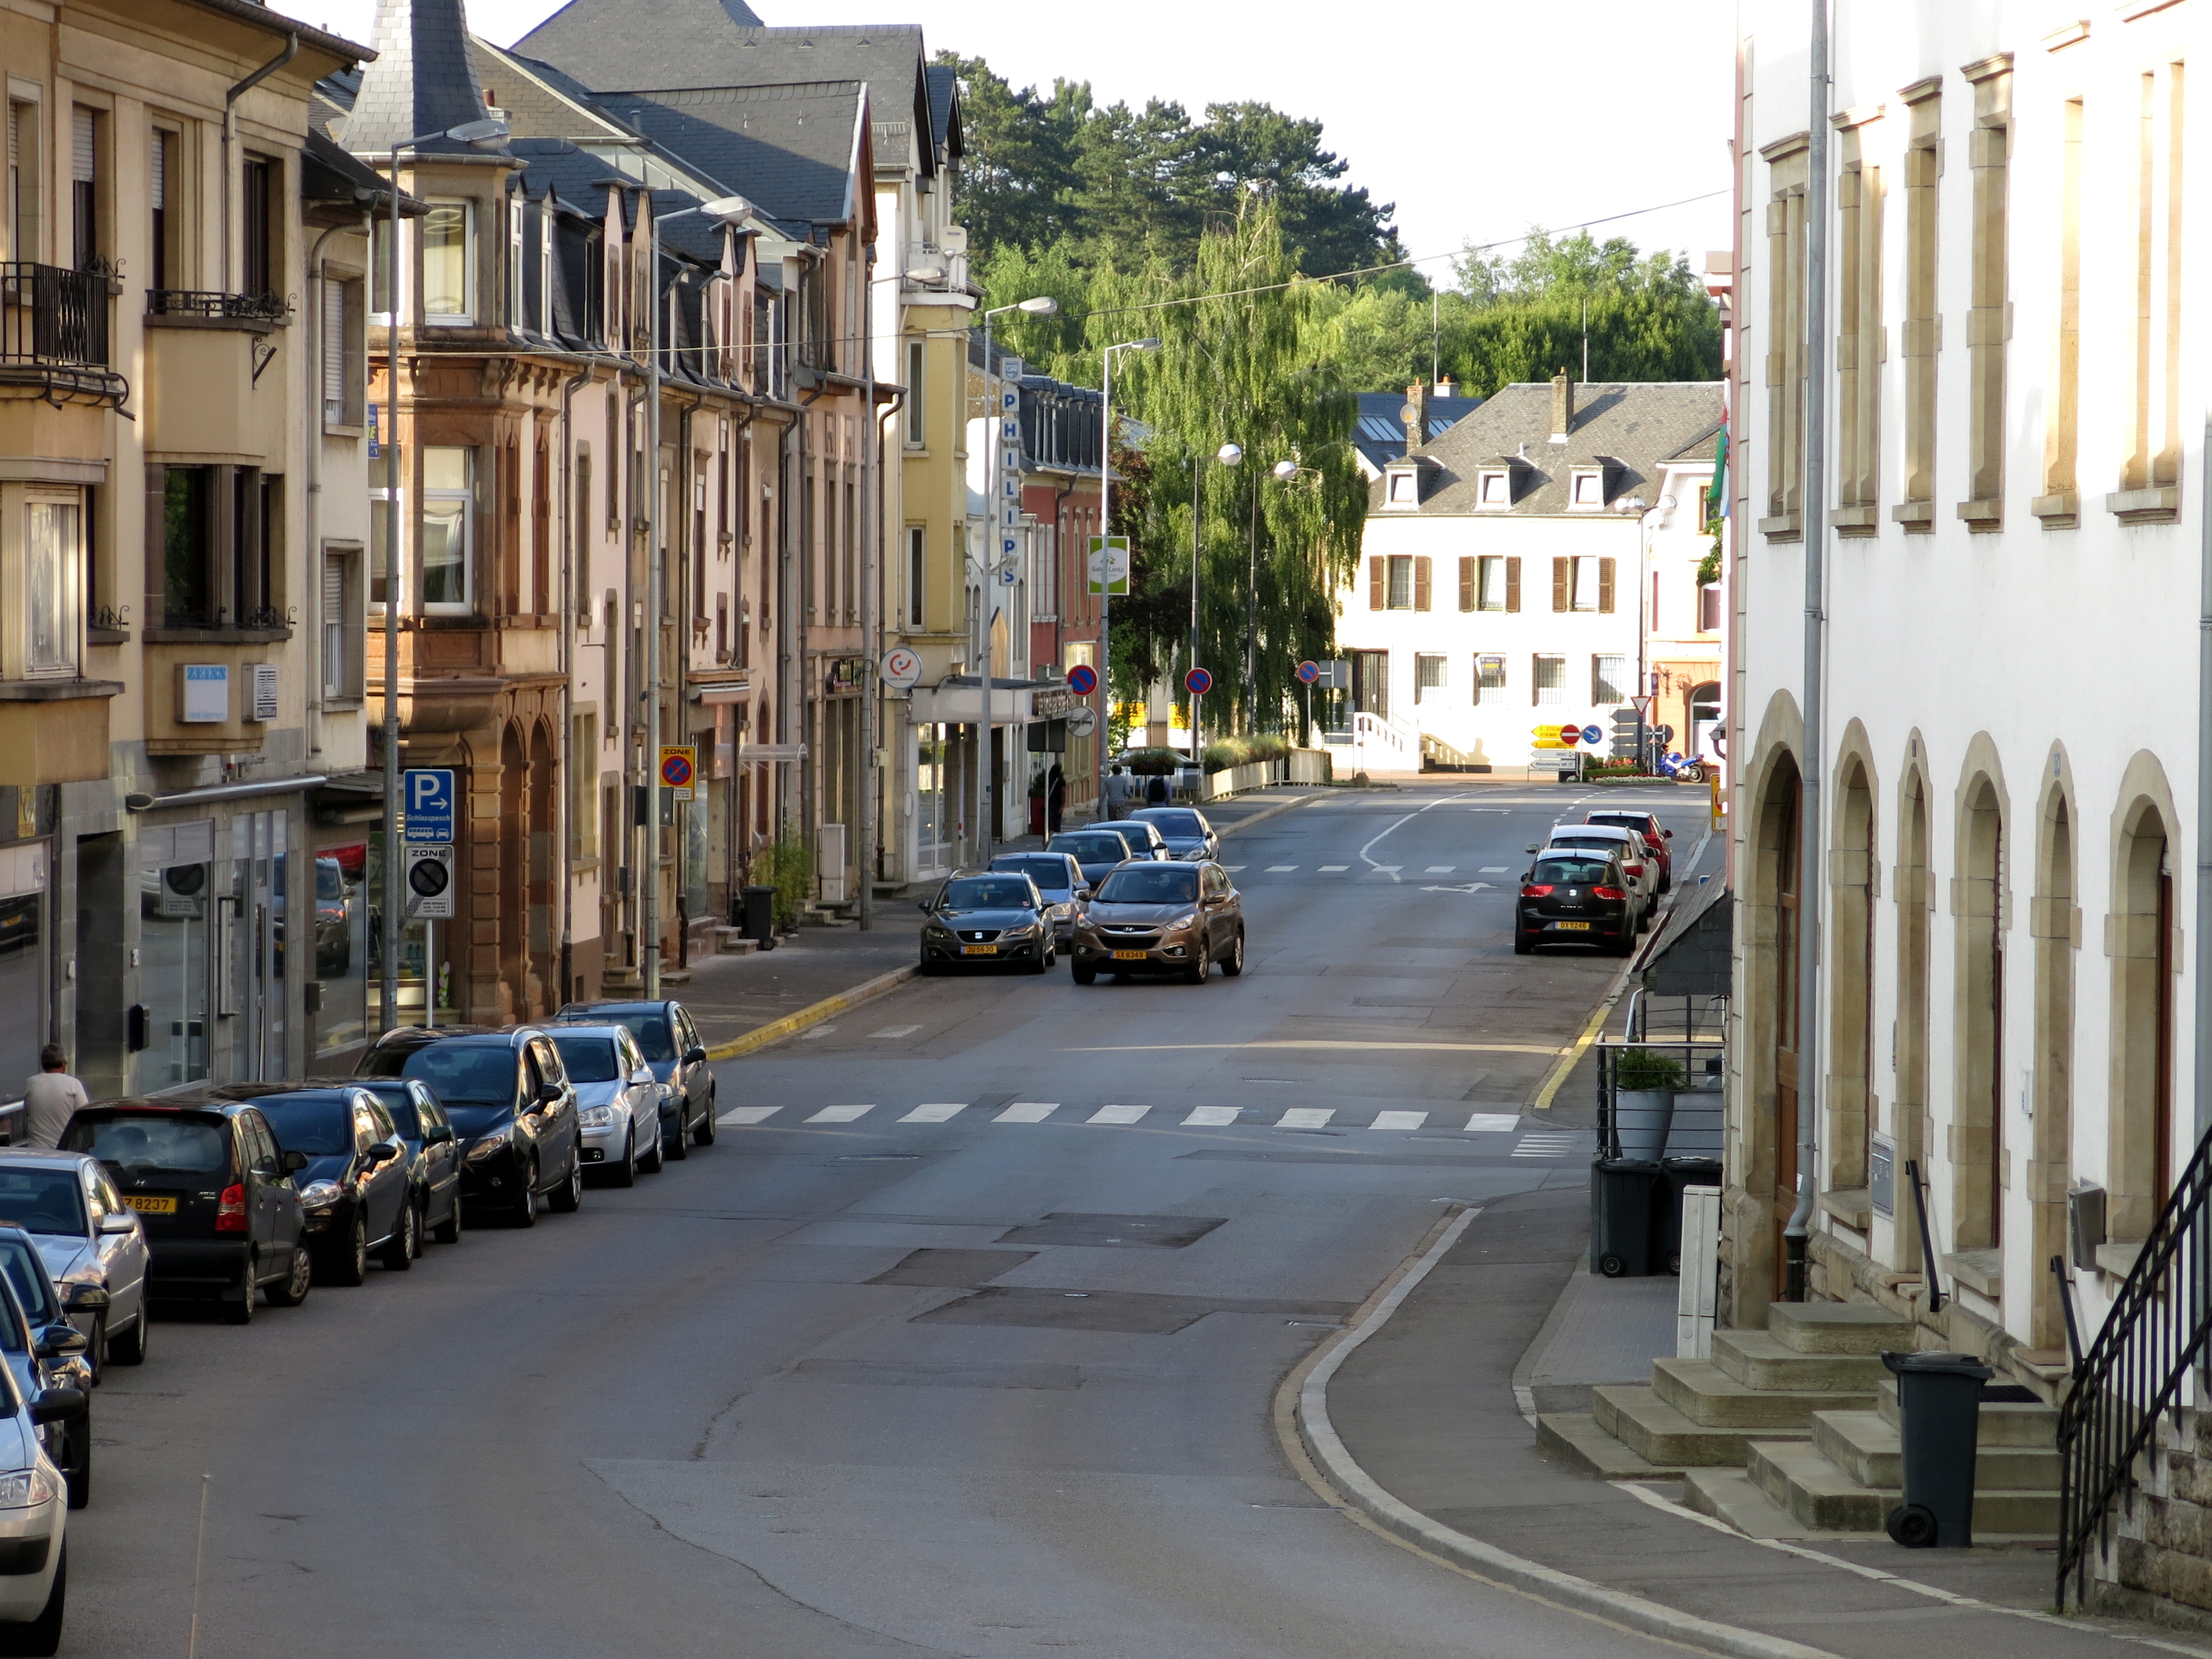
Oberfeulen
Oberfeulen (Luxembourgish: Uewerfeelen) is a small town in the commune of Feulen, in central Luxembourg. As of 2005, the town has a population of 277.
Oberfeulen Wikipedia Page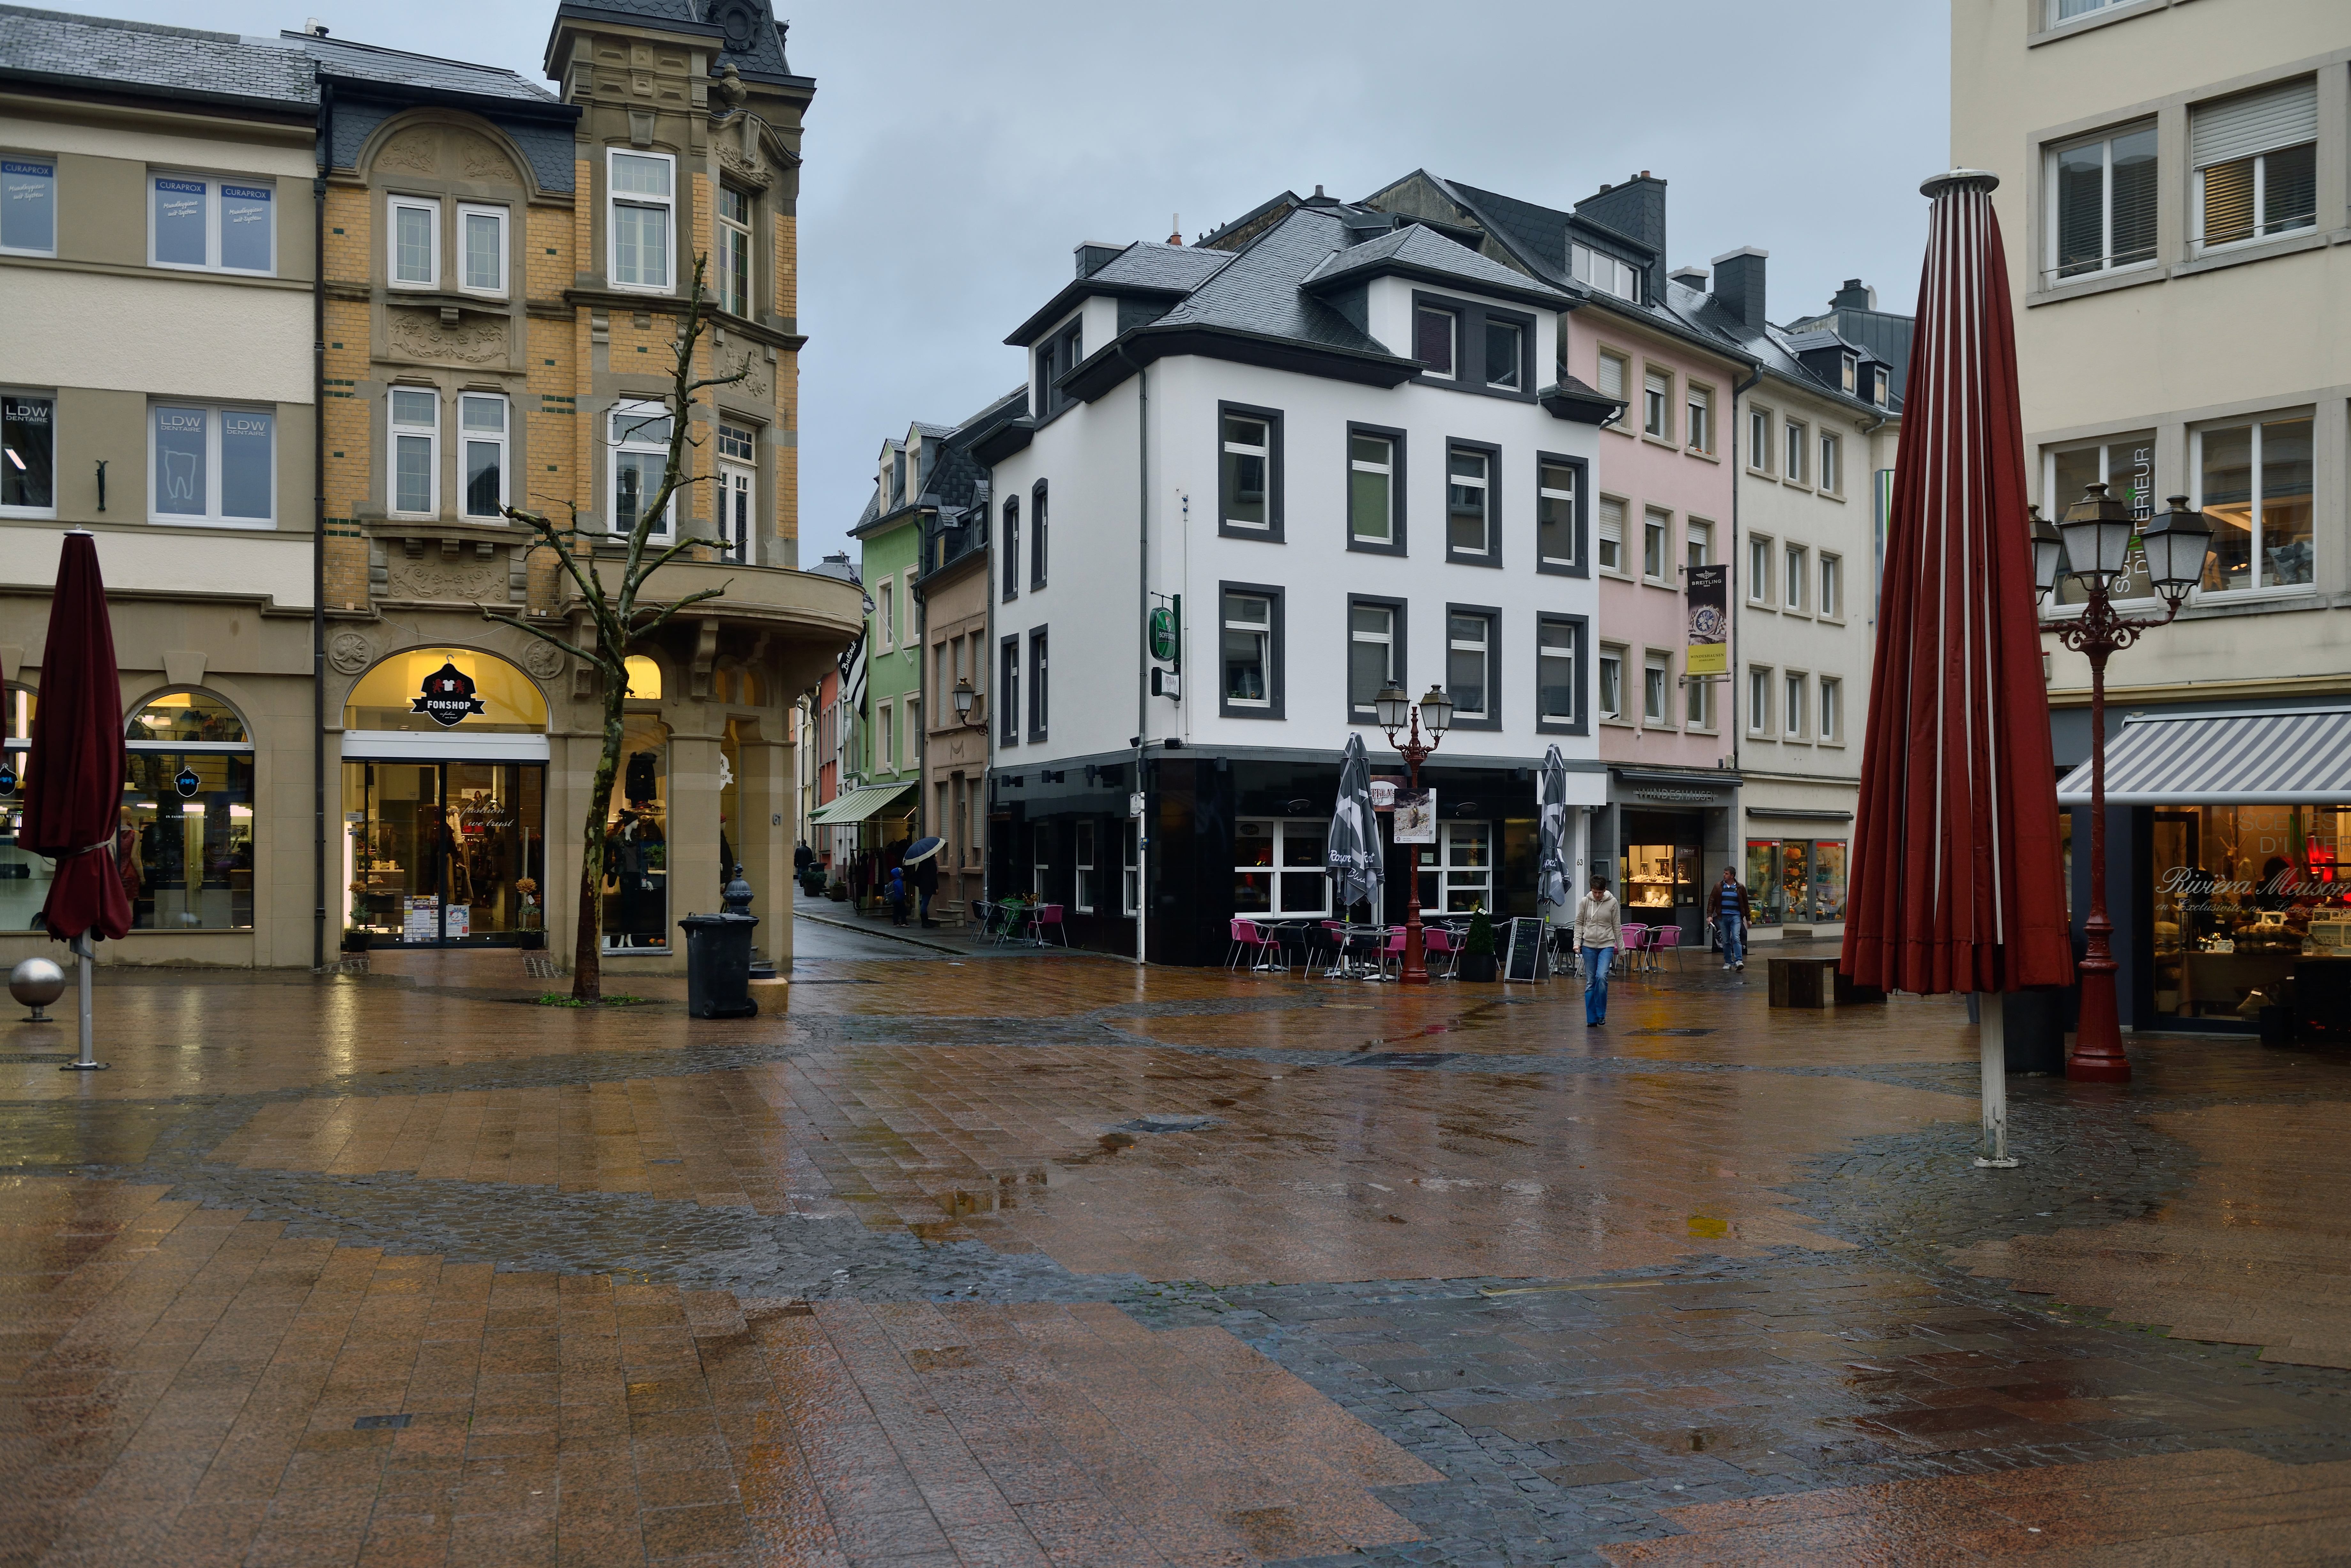

About Our Data
The data on this page is estimated using a number of publicly available tools and resources. It is provided without warranty, and could contain inaccuracies. Use at your own risk.