Industries
Business Distribution by Industry in Alsunga
| Industry Description | Number of Establishments |
|---|---|
| Cemeteries and crematoriums | 6 |
Alsunga Facts
| Area | 0.9 km² |
| Population | 376 |
| Male Population | 175 (46.6%) |
| Female Population | 201 (53.4%) |
| Population change (1975 to 2020) | -36.4% |
| Population change (2000 to 2020) | -39.1% |
| Median Age | 44.3 years (Male: 39.9, Female: 48.1) |
| GDP per capita (PPP) | $17,851 (2022) |
| Local Time | |
| Timezone | Eastern European Summer Time |
| Lat & Lng | 56.98194, 21.55938 |
| Postal Codes | LV-3306 |
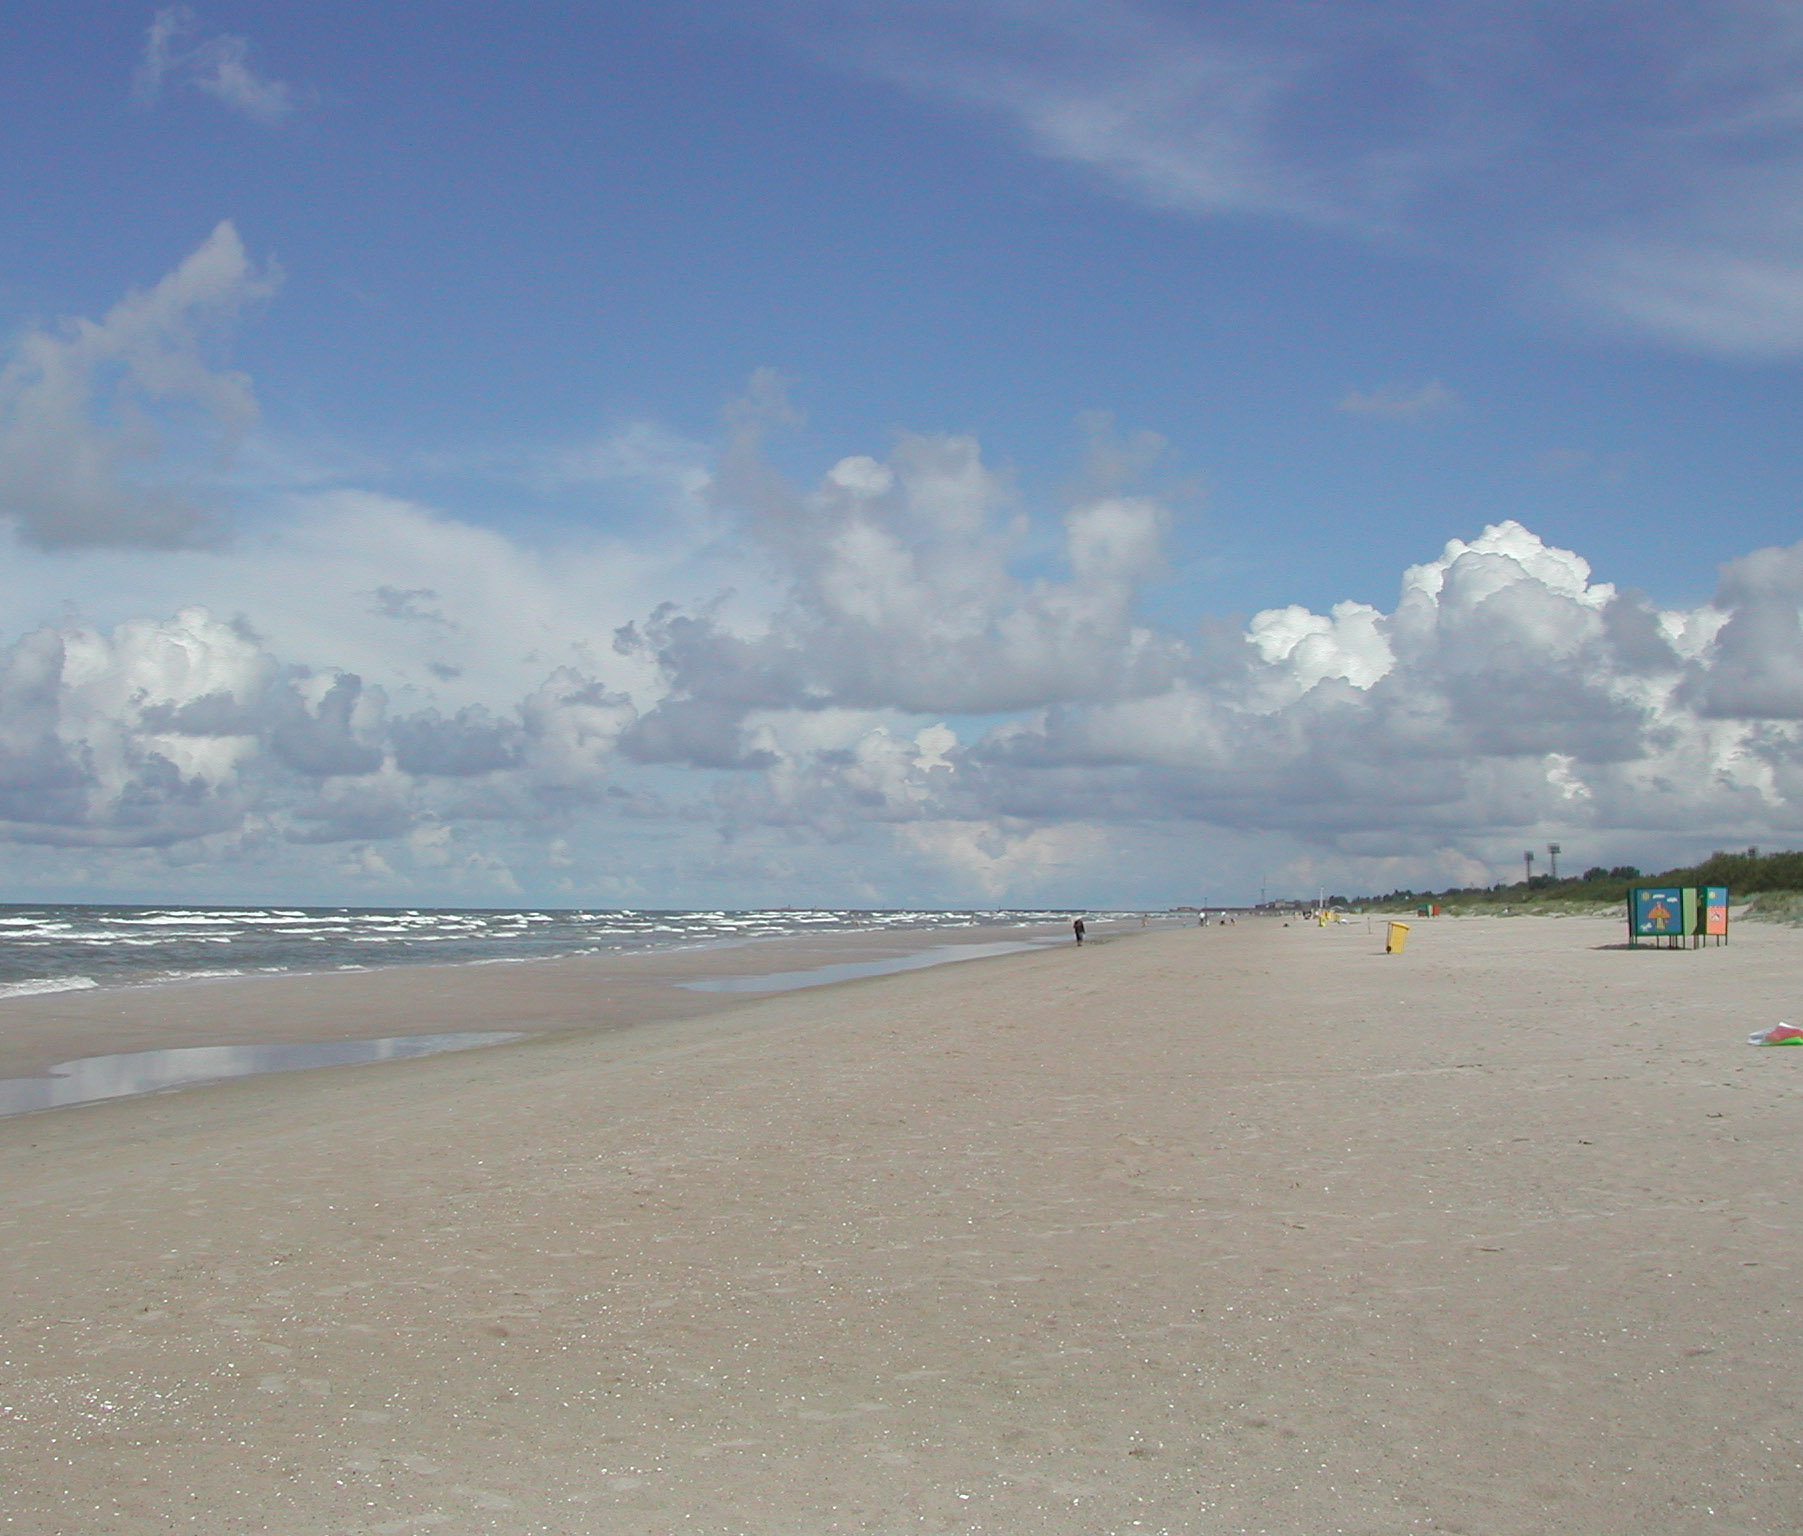
Map of Alsunga
Interactive Map
Alsunga Population
Years 1975 to 2030
| Data | 1975 | 1990 | 2000 | 2015 | 2020 | 2025* | 2030* |
|---|---|---|---|---|---|---|---|
| Population | 591 | 715 | 617 | 486 | 376 | 358 | 335 |
| Population Density | 675.4 / km² | 817.1 / km² | 705.1 / km² | 555.4 / km² | 429.7 / km² | 409.1 / km² | 382.9 / km² |
Alsunga Population change from 2000 to 2020
Decrease of 39.1% from year 2000 to 2020
| Location | Change since 1975 | Change since 1990 | Change since 2000 |
|---|---|---|---|
| Alsunga | -36.4% | -47.4% | -39.1% |
| Alsunga Municipality | — | — | — |
| Latvia | — | — | — |
Alsunga Median Age
Median Age: 44.3 years
| Location | Median Age | Median Age (Female) | Median Age (Male) |
|---|---|---|---|
| Alsunga | 44.3 yrs | 48.1 yrs | 39.9 yrs |
| Alsunga Municipality | 44.4 yrs | 48.1 yrs | 40 yrs |
| Latvia | 41.4 yrs | 45 yrs | 37.7 yrs |
Alsunga Population Density
Population Density: 430 / km²
| Location | Population | Area | Density |
|---|---|---|---|
| Alsunga | 376 | 0.875 km² | 430 / km² |
| Alsunga Municipality | 1,447 | 190.8 km² | 7.6 / km² |
| Latvia | 2 million | 64,581.9 km² | 30.4 / km² |
Alsunga Historical and Projected Population
Estimated Population from 100 to 2100
- JRC (European Commission's Joint Research Centre) work on the GHS built-up grid
- CIESIN (Center for International Earth Science Information Network)
- [Link] Klein Goldewijk, K., Beusen, A., Doelman, J., and Stehfest, E.: Anthropogenic land use estimates for the Holocene – HYDE 3.2, Earth Syst. Sci. Data, 9, 927–953, https://doi.org/10.5194/essd-9-927-2017, 2017.
Human Development Index (HDI)
Statistic composite index of life expectancy, education, and per capita income.
Alsunga Gross Domestic Product (GDP)
GDP per capita, PPP (constant 2017 international $)
| Data | 1990 | 1995 | 2000 | 2005 | 2010 | 2015 | 2020 | 2022 |
|---|---|---|---|---|---|---|---|---|
| GDP per capita | $14,733 | $8,314 | $9,149 | $12,265 | $10,858 | $12,129 | $15,741 | $17,851 |
| Total GDP | $22.3M | $12.8M | $13.3M | $17.1M | $14.8M | $16.2M | $20.4M | $22.9M |
Alsunga CO2 Emissions
Carbon Dioxide (CO2) Emissions Per Capita in Tonnes Per Year
| Location | CO2 Emissions | CO2 Emissions Per Capita | CO2 Emissions Intensity |
|---|---|---|---|
| Alsunga | 719 tn | 1.91 tn | 822.1 tons/km² |
| Alsunga Municipality | 2,768 tn | 1.91 tn | 14.5 tons/km² |
| Latvia | 3,698,181 tn | 1.88 tn | 57.3 tons/km² |
| 2013 CO2 emissions (tonnes/year) | 719 tn |
| 2013 CO2 emissions (tonnes/year) per capita | 1.91 tn |
| 2013 CO2 emissions intensity (tonnes/km²/year) | 822.1 tons/km² |
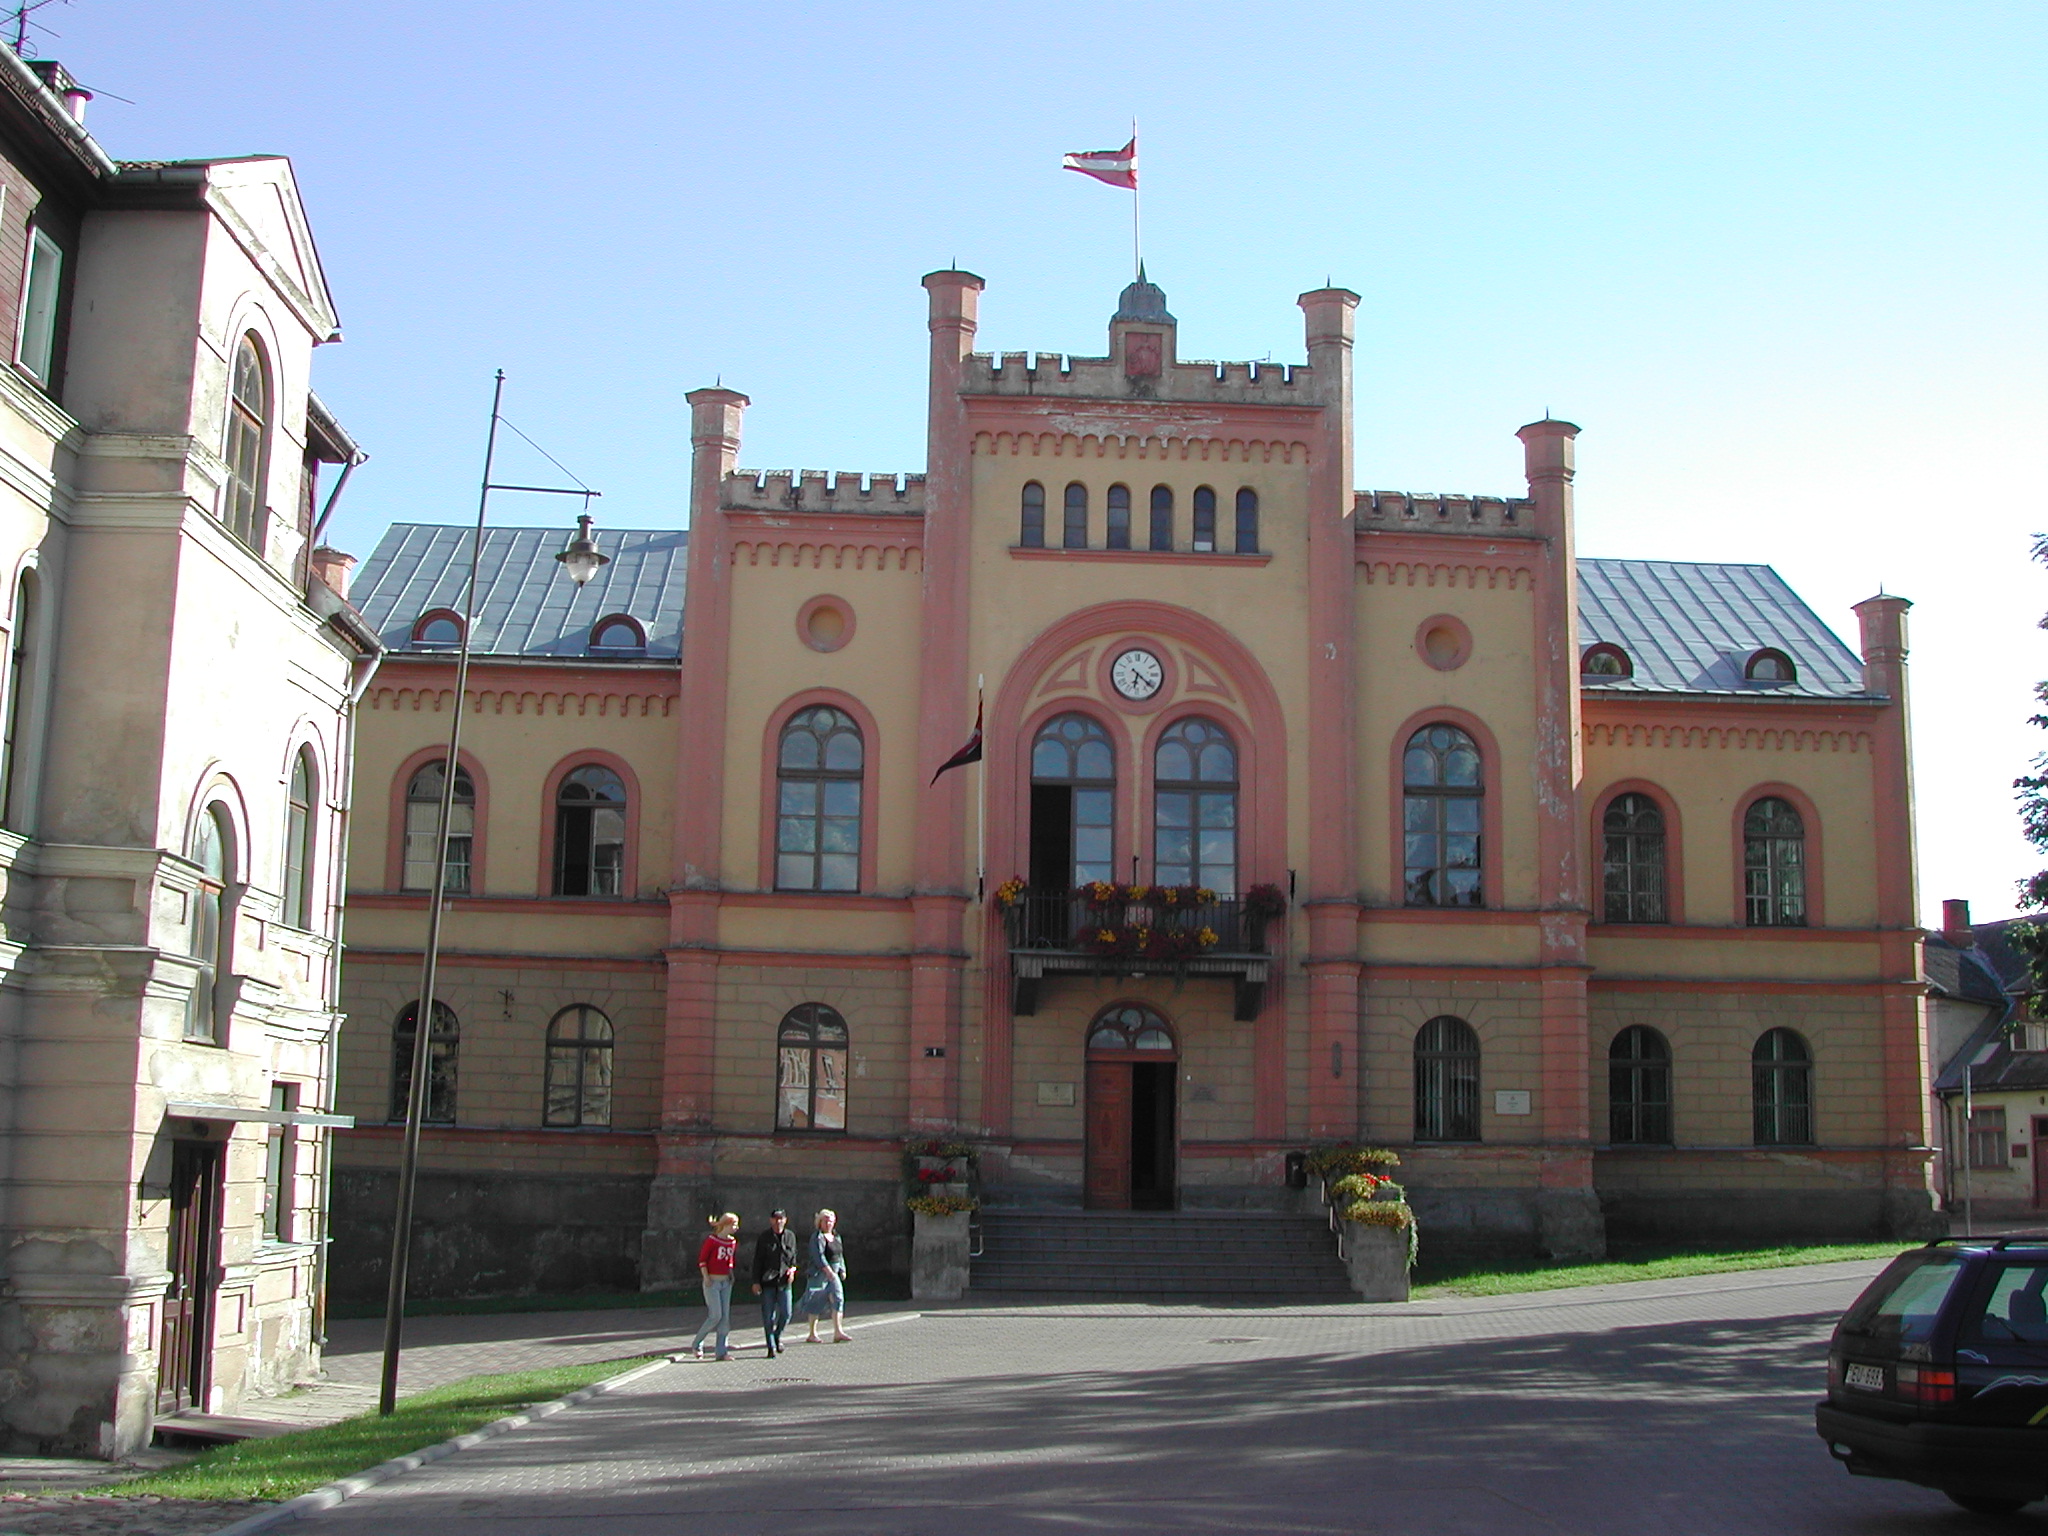
Alsunga
Alsunga (also Alšvanga, German: Alschwangen) is a village in Alsunga Municipality, Latvia. Alsunga is the center of the Suiti people – a small Catholic community in the Lutheran western part of Latvia. There are approximately 940 inhabitants in Alsun..
Alsunga Wikipedia Page

About Our Data
The data on this page is estimated using a number of publicly available tools and resources. It is provided without warranty, and could contain inaccuracies. Use at your own risk.