Categories in Auce
Gas stationClothing storesChurchesPolice and law enforcementRetirement homesConstruction of buildingsHardware storeEducationDance clubs and discothequesLibrariesAll food and beverageAmerican restaurantsBars, pubs and tavernsCafesGrocery stores and supermarketsRestaurantsCemeteries and crematoriumsPharmacies and drug storesBeauty salonsDepartment storesShoppingShopping otherCampgroundsPublic parksSports and recreationBuses and trainsUnreachable
Industries
Business Distribution by Industry in Auce
| Industry Description | Number of Establishments | Average Google Rating |
|---|---|---|
| Sports and recreation | 24 | — |
| Shopping | 18 | 4.1 |
| Real estate | 13 | 3.7 |
| Retirement homes | 10 | — |
| Buses and trains | 8 | — |
| Libraries | 8 | 5 |
| Health and medical | 7 | 4.8 |
| Grocery stores and supermarkets | 7 | — |
| Tractors and farm equipment | 7 | — |
| Education | 6 | 5 |
| Bars, pubs and taverns | 6 | — |
| Museums | 6 | — |
| Gas station | 5 | 4.5 |
| Cemeteries and crematoriums | 5 | — |
| Dentists | 5 | — |
| Department stores | 5 | 4.5 |
Auce Facts
| Area | 3.5 km² |
| Population | 3,181 |
| Population change (1975 to 2020) | -1.1% |
| Population change (2000 to 2020) | -16.0% |
| Local Time | |
| Timezone | Eastern European Summer Time |
| Lat & Lng | 56.45981, 22.90169 |
Map of Auce
Interactive Map
Auce Population
Years 1975 to 2020
| Data | 1975 | 1990 | 2000 | 2015 | 2020 |
|---|---|---|---|---|---|
| Population | 3,216 | 4,054 | 3,788 | 3,457 | 3,181 |
| Population Density | 918.9 / km² | 1,158.3 / km² | 1,082.3 / km² | 987.7 / km² | 908.9 / km² |
Sources: JRC (European Commission's Joint Research Centre) work on the GHS built-up grid
Auce Population change from 2000 to 2015
Decrease of 8.7% from year 2000 to 2015
| Location | Change since 1975 | Change since 1990 | Change since 2000 |
|---|---|---|---|
| Auce | +7.5% | -14.7% | -8.7% |
| Auce Municipality | +57.2% | +11.9% | +6.2% |
| Latvia | -19.9% | -26.1% | -16.9% |
Sources: JRC (European Commission's Joint Research Centre) work on the GHS built-up grid
Auce Population Density
Population Density: 909 / km²
| Location | Population | Area | Density |
|---|---|---|---|
| Auce | 3,181 | 3.5 km² | 909 / km² |
| Auce Municipality | 7,458 | 517 km² | 14.4 / km² |
| Latvia | 2 million | 64,581.9 km² | 30.4 / km² |
Sources: JRC (European Commission's Joint Research Centre) work on the GHS built-up grid
Auce Historical and Projected Population
Estimated Population from 900 to 2100
Sources:
- JRC (European Commission's Joint Research Centre) work on the GHS built-up grid
- CIESIN (Center for International Earth Science Information Network)
- [Link] Klein Goldewijk, K., Beusen, A., Doelman, J., and Stehfest, E.: Anthropogenic land use estimates for the Holocene – HYDE 3.2, Earth Syst. Sci. Data, 9, 927–953, https://doi.org/10.5194/essd-9-927-2017, 2017.
Price Distribution
Business distribution by price for Auce
Human Development Index (HDI)
Statistic composite index of life expectancy, education, and per capita income.
Source: [Link] Kummu, M., Taka, M. &Guillaume, J. Gridded global datasets for Gross Domestic Product and Human Development Index over 1990–2015. Sci Data 5, 180004 (2018) doi:10.1038/sdata.2018.4
Auce CO2 Emissions
Carbon Dioxide (CO2) Emissions Per Capita in Tonnes Per Year
| Location | CO2 Emissions | CO2 Emissions Per Capita | CO2 Emissions Intensity |
|---|---|---|---|
| Auce | 5,824 tn | 1.83 tn | 1,664 tons/km² |
| Auce Municipality | 14,650 tn | 1.96 tn | 28.3 tons/km² |
| Latvia | 3,698,181 tn | 1.88 tn | 57.3 tons/km² |
Sources: [Link] Moran, D., Kanemoto K; Jiborn, M., Wood, R., Többen, J., and Seto, K.C. (2018) Carbon footprints of 13,000 cities. Environmental Research Letters DOI: 10.1088/1748-9326/aac72a
Auce CO2 Emissions
| 2013 CO2 emissions (tonnes/year) | 5,824 tn |
| 2013 CO2 emissions (tonnes/year) per capita | 1.83 tn |
| 2013 CO2 emissions intensity (tonnes/km²/year) | 1,664 tons/km² |
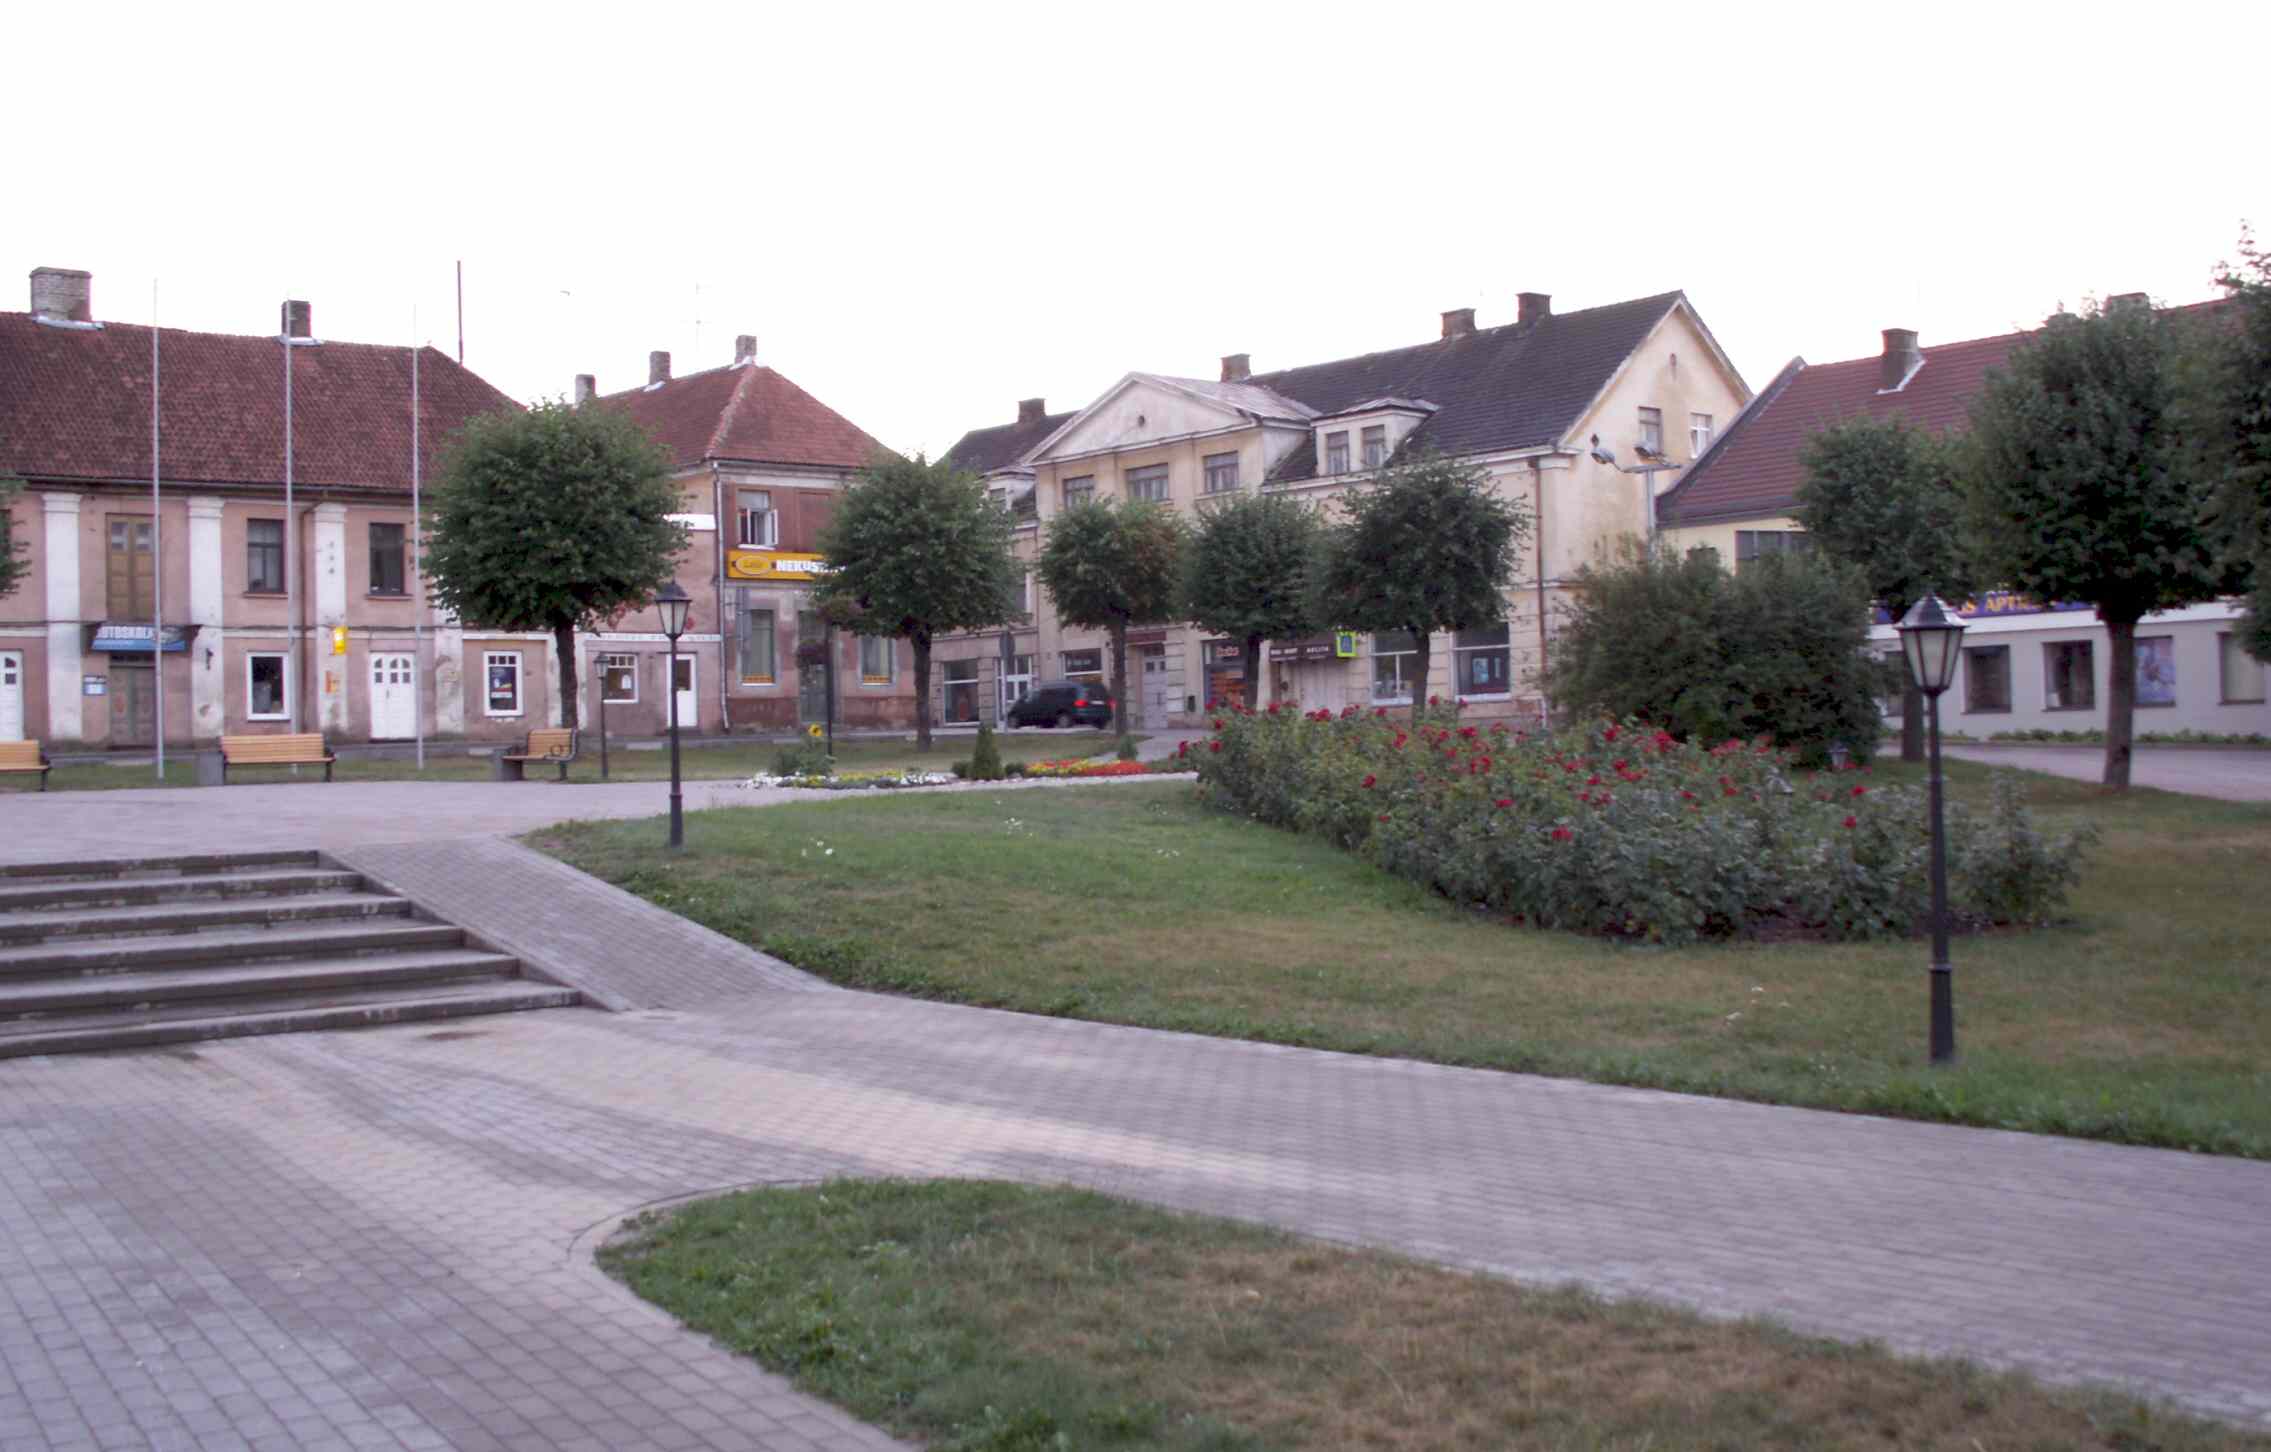
Auce
Auce ( pronunciation ; German: Alt-Autz) is a town in southern Latvia near the Lithuanian border.
Auce Wikipedia Page


About Our Data
The data on this page is estimated using a number of publicly available tools and resources. It is provided without warranty, and could contain inaccuracies. Use at your own risk.