Categories in Pāvilosta
Industries
Business Distribution by Industry in Pāvilosta
| Industry Description | Number of Establishments |
|---|---|
| Other accommodation | 5 |
Pāvilosta Facts
| Area | 1.4 km² |
| Population | 289 |
| Population change (1975 to 2020) | -72.0% |
| Population change (2000 to 2020) | -75.0% |
| Local Time | |
| Timezone | Eastern European Summer Time |
| Lat & Lng | 56.88791, 21.18593 |
Map of Pāvilosta
Interactive Map
Pāvilosta Population
Years 1975 to 2030
| Data | 1975 | 1990 | 2000 | 2015 | 2020 | 2025* | 2030* |
|---|---|---|---|---|---|---|---|
| Population | 1,032 | 1,357 | 1,155 | 887 | 289 | 276 | 261 |
| Population Density | 717.9 / km² | 944 / km² | 803.5 / km² | 617 / km² | 201 / km² | 192 / km² | 181.6 / km² |
* Projected
Sources: JRC (European Commission's Joint Research Centre) work on the GHS built-up gridPāvilosta Population change from 2000 to 2020
Decrease of 75% from year 2000 to 2020
| Location | Change since 1975 | Change since 1990 | Change since 2000 |
|---|---|---|---|
| Pāvilosta | -72% | -78.7% | -75% |
| Pāvilosta Municipality | — | — | — |
| Latvia | — | — | — |
Sources: JRC (European Commission's Joint Research Centre) work on the GHS built-up grid
Pāvilosta Population Density
Population Density: 201 / km²
| Location | Population | Area | Density |
|---|---|---|---|
| Pāvilosta | 289 | 1.438 km² | 201 / km² |
| Pāvilosta Municipality | 2,831 | 516 km² | 5.5 / km² |
| Latvia | 2 million | 64,581.9 km² | 30.4 / km² |
Sources: JRC (European Commission's Joint Research Centre) work on the GHS built-up grid
Pāvilosta Historical and Projected Population
Estimated Population from 0 to 2100
Sources:
- JRC (European Commission's Joint Research Centre) work on the GHS built-up grid
- CIESIN (Center for International Earth Science Information Network)
- [Link] Klein Goldewijk, K., Beusen, A., Doelman, J., and Stehfest, E.: Anthropogenic land use estimates for the Holocene – HYDE 3.2, Earth Syst. Sci. Data, 9, 927–953, https://doi.org/10.5194/essd-9-927-2017, 2017.
Area Codes
Percentage Area Codes used by businesses in Pāvilosta
Price Distribution
Business distribution by price for Pāvilosta
Human Development Index (HDI)
Statistic composite index of life expectancy, education, and per capita income.
Source: [Link] Kummu, M., Taka, M. &Guillaume, J. Gridded global datasets for Gross Domestic Product and Human Development Index over 1990–2015. Sci Data 5, 180004 (2018) doi:10.1038/sdata.2018.4
Pāvilosta CO2 Emissions
Carbon Dioxide (CO2) Emissions Per Capita in Tonnes Per Year
| Location | CO2 Emissions | CO2 Emissions Per Capita | CO2 Emissions Intensity |
|---|---|---|---|
| Pāvilosta | 553 tn | 1.91 tn | 384.6 tons/km² |
| Pāvilosta Municipality | 5,447 tn | 1.92 tn | 10.6 tons/km² |
| Latvia | 3,698,181 tn | 1.88 tn | 57.3 tons/km² |
Sources: [Link] Moran, D., Kanemoto K; Jiborn, M., Wood, R., Többen, J., and Seto, K.C. (2018) Carbon footprints of 13,000 cities. Environmental Research Letters DOI: 10.1088/1748-9326/aac72a
Pāvilosta CO2 Emissions
| 2013 CO2 emissions (tonnes/year) | 553 tn |
| 2013 CO2 emissions (tonnes/year) per capita | 1.91 tn |
| 2013 CO2 emissions intensity (tonnes/km²/year) | 384.6 tons/km² |
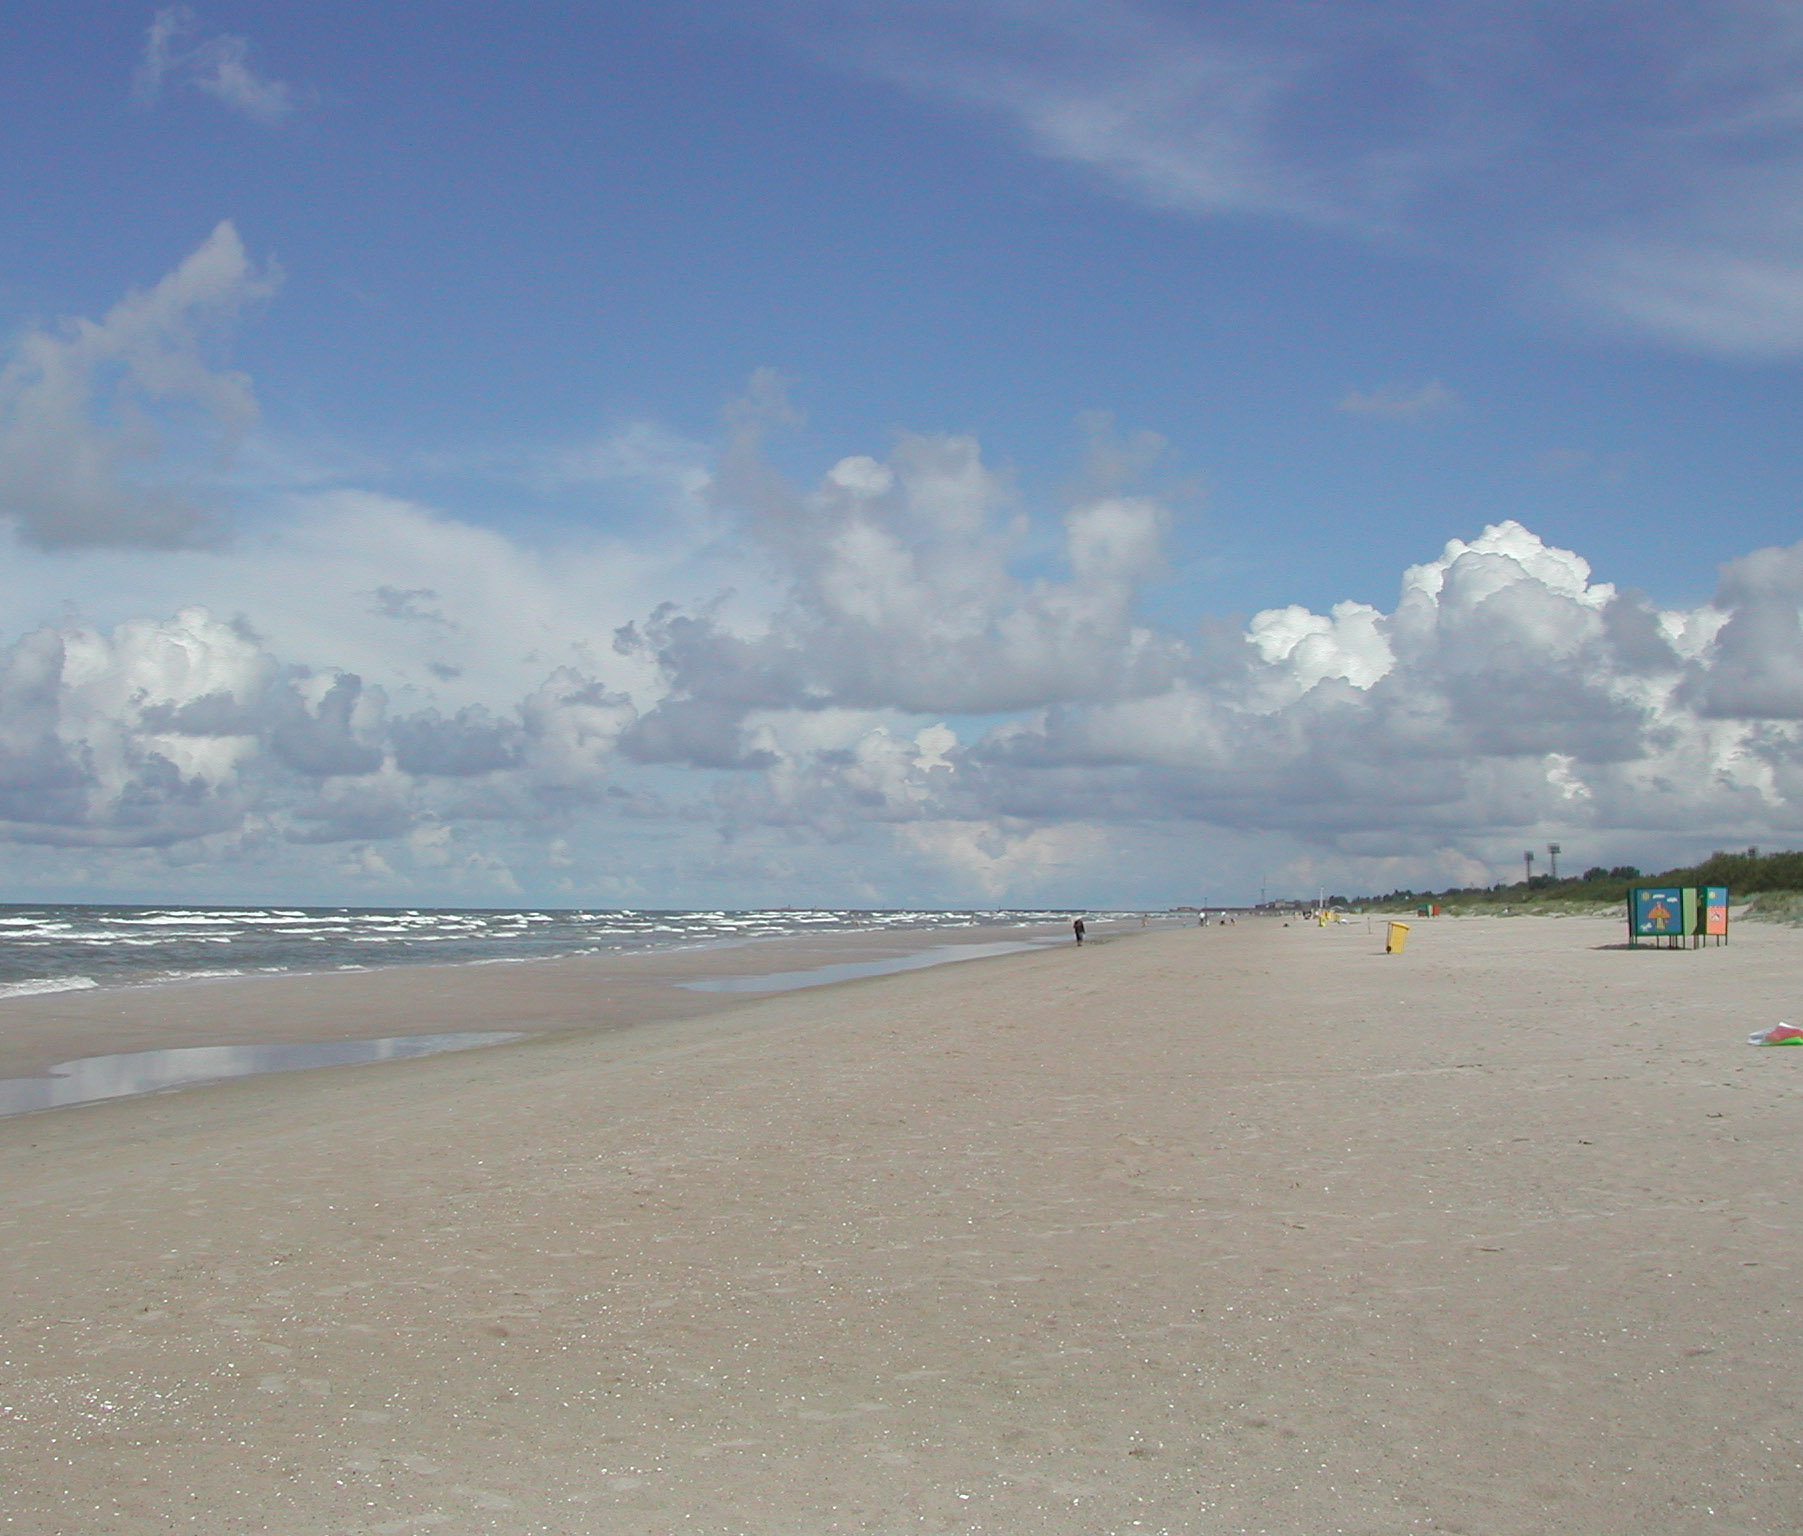
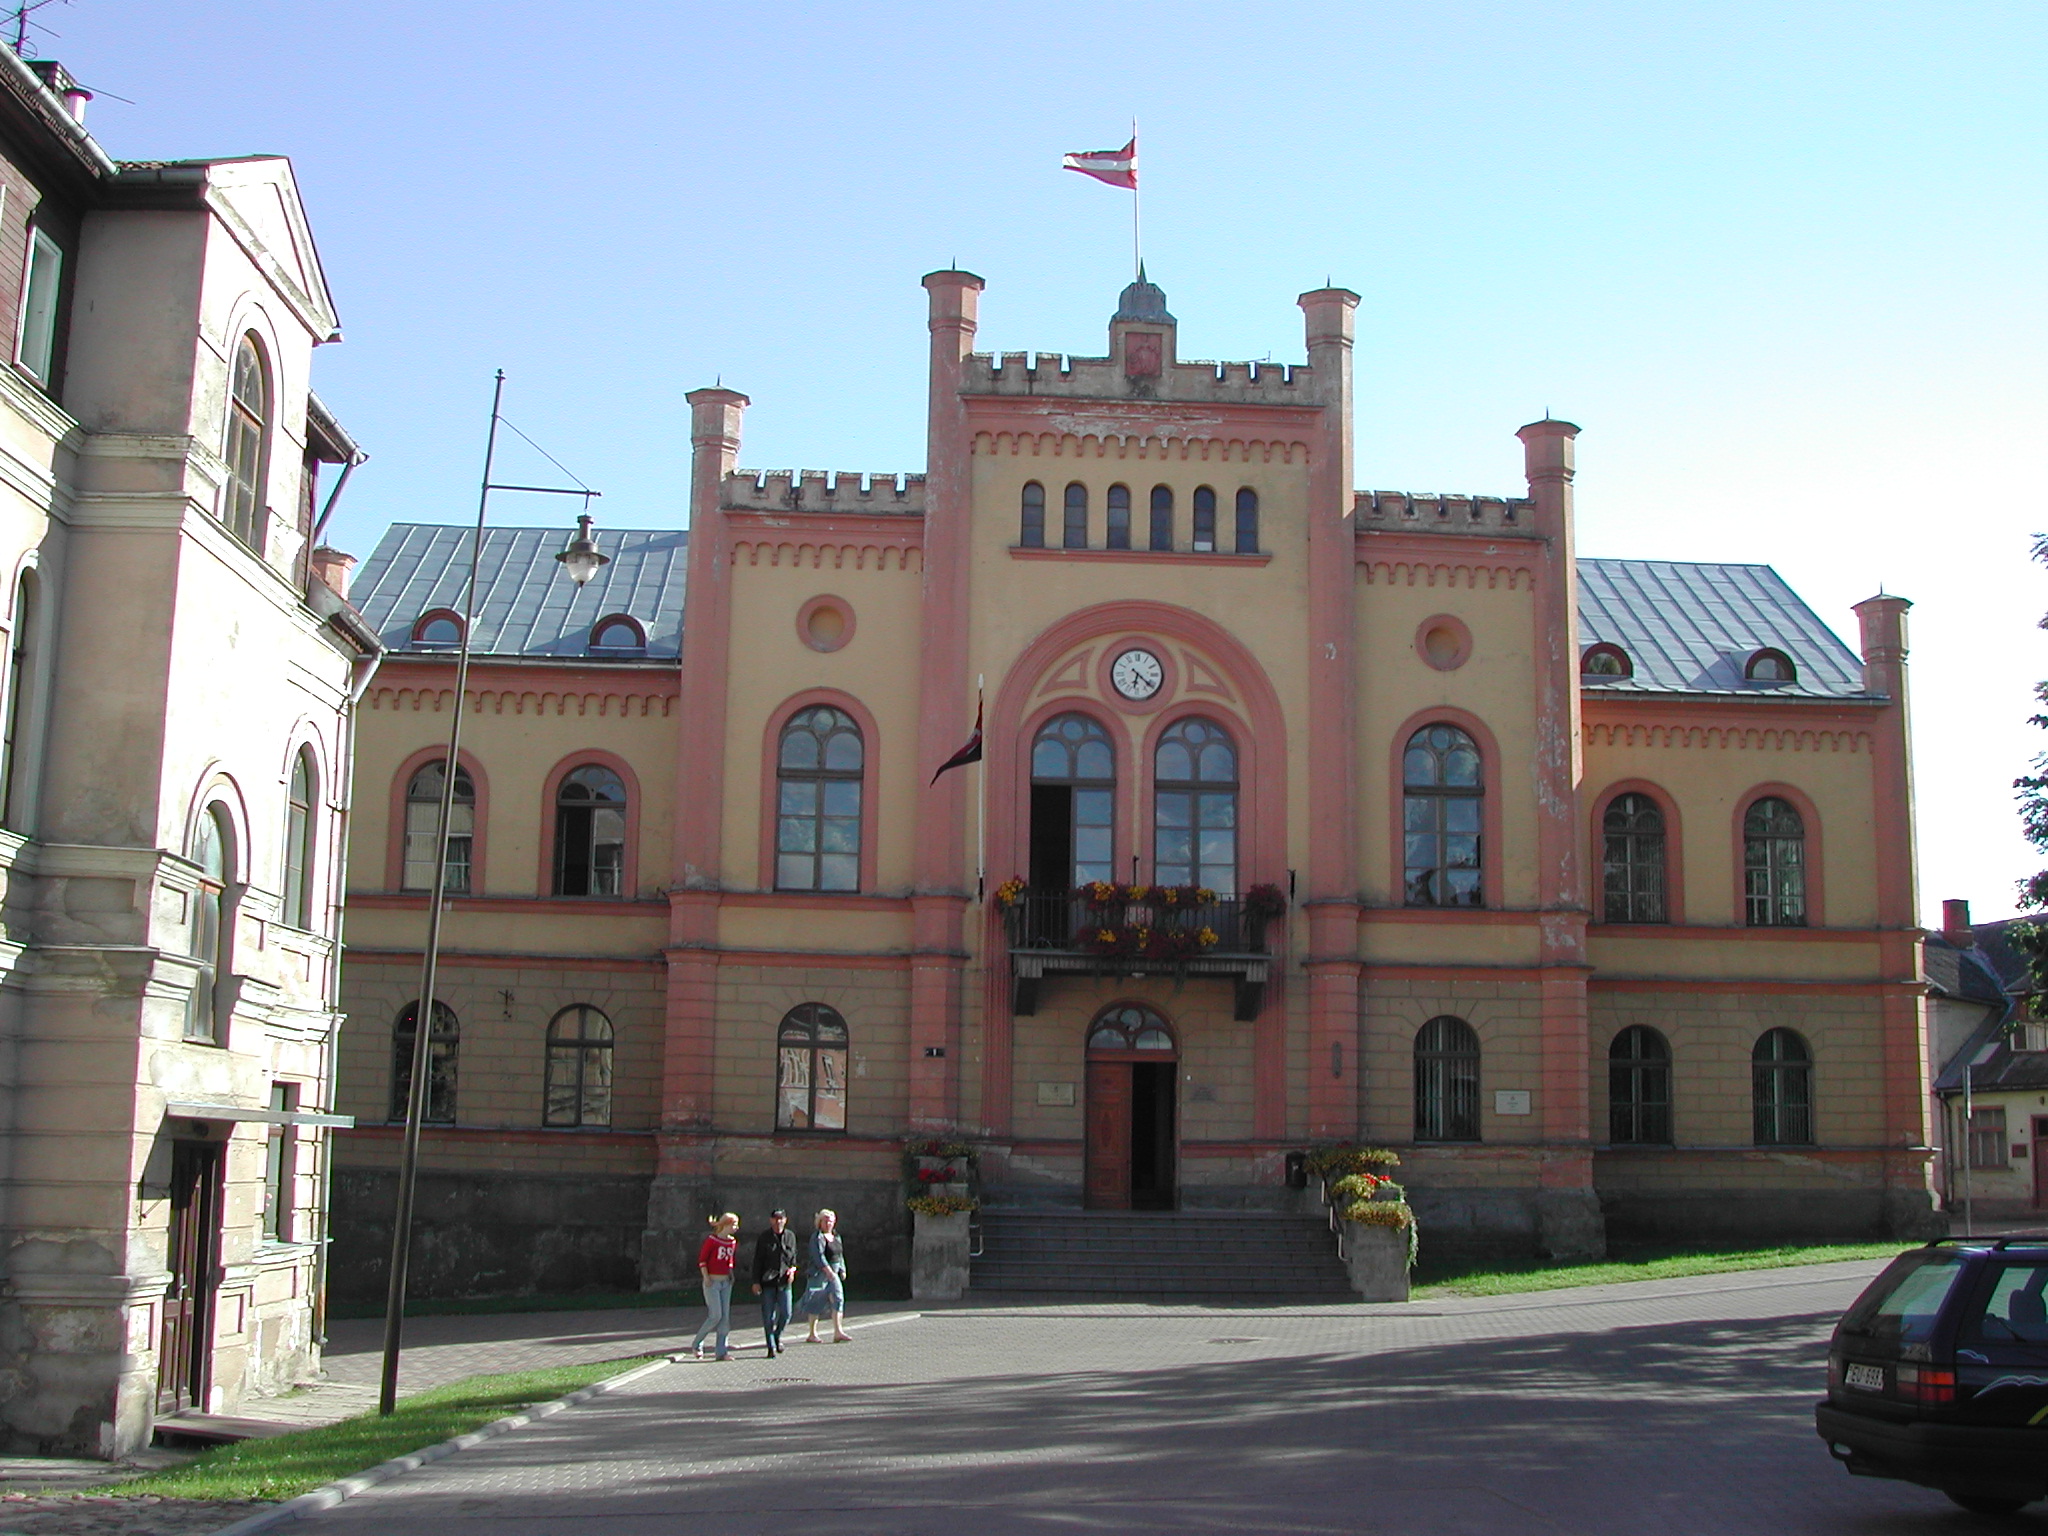
Pāvilosta
Pāvilosta ( pronunciation ; German: Paulshafen) is a small port town in Latvia located at the mouth of Saka river in Courland.
Pāvilosta Wikipedia Page

About Our Data
The data on this page is estimated using a number of publicly available tools and resources. It is provided without warranty, and could contain inaccuracies. Use at your own risk.