Ansongo Facts
| Area | 20572.6 km² |
| Population | 201,690 |
| Male Population | 101,083 (50.1%) |
| Female Population | 100,607 (49.9%) |
| Population change (1975 to 2020) | +345.3% |
| Population change (2000 to 2020) | +99.3% |
| Median Age | 16 years (Male: 15.2, Female: 16.7) |
| Local Time | |
| Timezone | Greenwich Mean Time |
| Lat & Lng | 15.65970, 0.50220 |
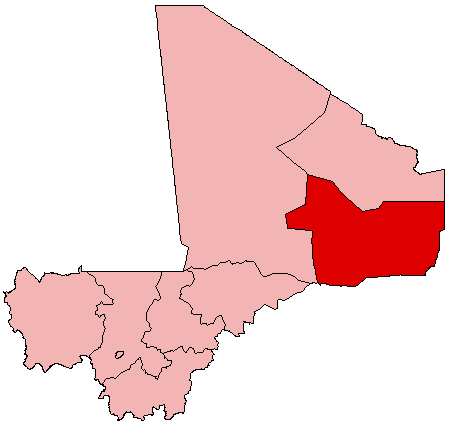
Map of Ansongo
Interactive Map
Ansongo Population
Years 1975 to 2020
| Data | 1975 | 1990 | 2000 | 2015 | 2020 |
|---|---|---|---|---|---|
| Population | 45,297 | 71,773 | 101,181 | 181,266 | 201,690 |
| Population Density | 2.2 / km² | 3.5 / km² | 4.9 / km² | 8.8 / km² | 9.8 / km² |
Ansongo Population change from 2000 to 2015
Increase of 79.2% from year 2000 to 2015
| Location | Change since 1975 | Change since 1990 | Change since 2000 |
|---|---|---|---|
| Ansongo | +300.2% | +152.6% | +79.2% |
| Gao Region | +254.6% | +139.3% | +73% |
| Mali | +173.2% | +108.4% | +59.6% |
Ansongo Median Age
Median Age: 16 years
| Location | Median Age | Median Age (Female) | Median Age (Male) |
|---|---|---|---|
| Ansongo | 16 yrs | 16.7 yrs | 15.2 yrs |
| Gao Region | 16 yrs | 16.7 yrs | 15.2 yrs |
| Mali | 16.1 yrs | 16.6 yrs | 15.5 yrs |
Ansongo Population Density
Population Density: 9.8 / km²
| Location | Population | Area | Density |
|---|---|---|---|
| Ansongo | 201,690 | 20,572.6 km² | 9.8 / km² |
| Gao Region | 678,995 | 177,825.5 km² | 3.8 / km² |
| Mali | 17.7 million | 1,252,394 km² | 14.1 / km² |
Ansongo Historical and Projected Population
Estimated Population from 1300 to 2100
- JRC (European Commission's Joint Research Centre) work on the GHS built-up grid
- CIESIN (Center for International Earth Science Information Network)
- [Link] Klein Goldewijk, K., Beusen, A., Doelman, J., and Stehfest, E.: Anthropogenic land use estimates for the Holocene – HYDE 3.2, Earth Syst. Sci. Data, 9, 927–953, https://doi.org/10.5194/essd-9-927-2017, 2017.
Area Codes
Percentage Area Codes used by businesses in Ansongo
Human Development Index (HDI)
Statistic composite index of life expectancy, education, and per capita income.
Ansongo CO2 Emissions
Carbon Dioxide (CO2) Emissions Per Capita in Tonnes Per Year
| Location | CO2 Emissions | CO2 Emissions Per Capita | CO2 Emissions Intensity |
|---|---|---|---|
| Ansongo | 27,794 tn | 0.14 tn | 1.4 tons/km² |
| Gao Region | 93,515 tn | 0.14 tn | 0.5 tons/km² |
| Mali | 2,464,946 tn | 0.14 tn | 2 tons/km² |
| 2013 CO2 emissions (tonnes/year) | 27,794 tn |
| 2013 CO2 emissions (tonnes/year) per capita | 0.14 tn |
| 2013 CO2 emissions intensity (tonnes/km²/year) | 1.4 tons/km² |
Natural Hazards Risk
Relative risk out of 10
| Hazard | Risk Level |
|---|---|
| Drought | Medium (5) |
| Flood | Medium (7) |
* Risk, particularly concerning flood or landslide, may not be for the entire area.
- Dilley, M., R.S. Chen, U. Deichmann, A.L. Lerner-Lam, M. Arnold, J. Agwe, P. Buys, O. Kjekstad, B. Lyon, and G. Yetman. 2005. Natural Disaster Hotspots: A Global Risk Analysis. Washington, D.C.: World Bank. https://doi.org/10.1596/0-8213-5930-4.
- Center for Hazards and Risk Research - CHRR - Columbia University, Center for International Earth Science Information Network - CIESIN - Columbia University, and International Research Institute for Climate and Society - IRI - Columbia University. 2005. Global Drought Hazard Frequency and Distribution. Palisades, NY: NASA Socioeconomic Data and Applications Center (SEDAC). https://doi.org/10.7927/H4VX0DFT.
- Center for Hazards and Risk Research - CHRR - Columbia University, Center for International Earth Science Information Network - CIESIN - Columbia University. 2005. Global Flood Hazard Frequency and Distribution. Palisades, NY: NASA Socioeconomic Data and Applications Center (SEDAC). https://doi.org/10.7927/H4668B3D.
Ansongo
Ansongo is a rural commune and small town in the Gao Region of eastern Mali. The town lies on the left bank of the Niger River 90 km south of Gao. It is the administrative center for the surrounding Ansongo Cercle. The commune covers an area of 445 s..
Ansongo Wikipedia Page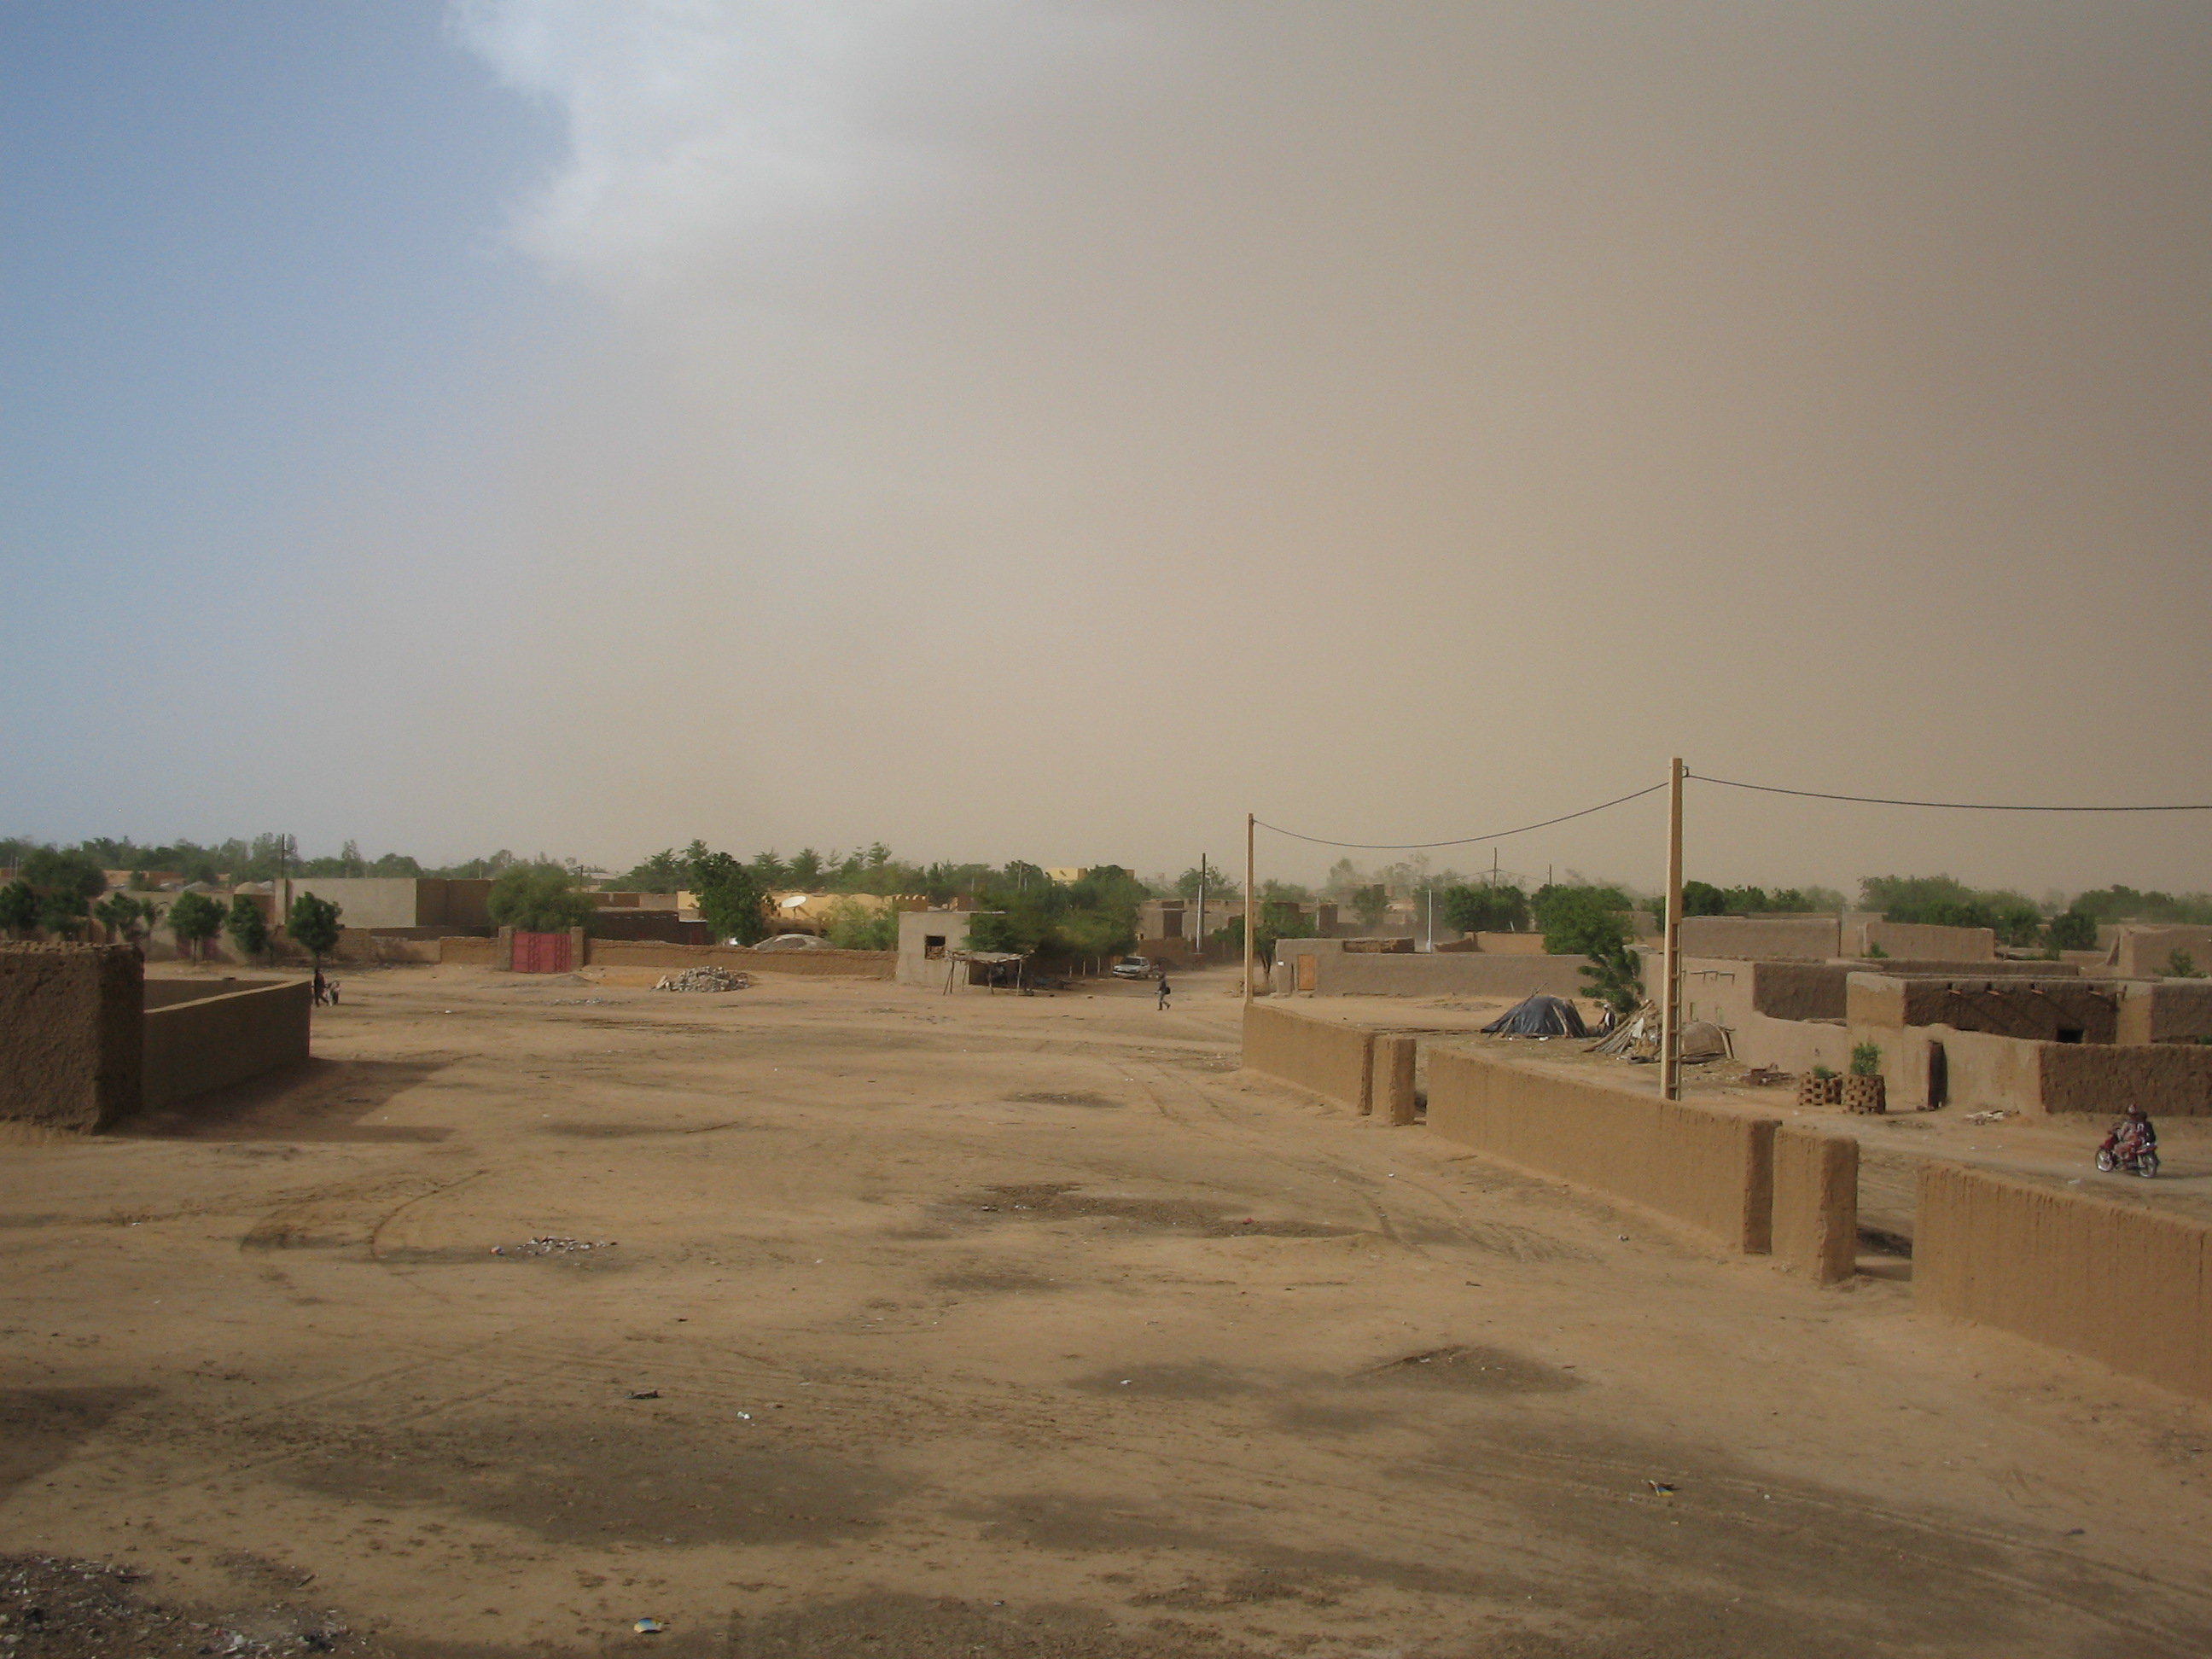

About Our Data
The data on this page is estimated using a number of publicly available tools and resources. It is provided without warranty, and could contain inaccuracies. Use at your own risk.