Chanal Facts
| Area | 345.1 km² |
| Population | 14,412 |
| Male Population | 7,168 (49.7%) |
| Female Population | 7,244 (50.3%) |
| Population change (1975 to 2020) | +435.2% |
| Population change (2000 to 2020) | +76.9% |
| Median Age | 15 years (Male: 15, Female: 15.1) |
| GDP per capita (PPP) | $5,191 (2022) |
| Local Time | |
| Timezone | Central Standard Time |
| Lat & Lng | 16.65750, -92.25750 |
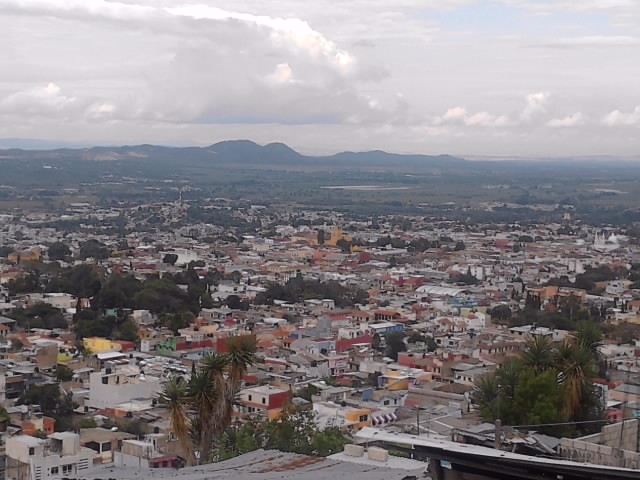
Map of Chanal
Interactive Map
Chanal Population
Years 1975 to 2030
| Data | 1975 | 1990 | 2000 | 2015 | 2020 | 2025* | 2030* |
|---|---|---|---|---|---|---|---|
| Population | 2,693 | 5,442 | 8,148 | 13,285 | 14,412 | 15,241 | 16,085 |
| Population Density | 7.8 / km² | 15.8 / km² | 23.6 / km² | 38.5 / km² | 41.8 / km² | 44.2 / km² | 46.6 / km² |
* Projected
Sources: JRC (European Commission's Joint Research Centre) work on the GHS built-up gridChanal Population change from 2000 to 2020
Increase of 76.9% from year 2000 to 2020
| Location | Change since 1975 | Change since 1990 | Change since 2000 |
|---|---|---|---|
| Chanal | +435.2% | +164.8% | +76.9% |
| Chiapas | — | — | — |
| Mexico | — | — | — |
Sources: JRC (European Commission's Joint Research Centre) work on the GHS built-up grid
Chanal Median Age
Median Age: 15 years
| Location | Median Age | Median Age (Female) | Median Age (Male) |
|---|---|---|---|
| Chanal | 15 yrs | 15.1 yrs | 15 yrs |
| Chiapas | 22.2 yrs | 22.7 yrs | 21.6 yrs |
| Mexico | 26.2 yrs | 27 yrs | 25.3 yrs |
Sources: CIESIN (Center for International Earth Science Information Network)
Chanal Population Density
Population Density: 41.8 / km²
| Location | Population | Area | Density |
|---|---|---|---|
| Chanal | 14,412 | 345.1 km² | 41.8 / km² |
| Chiapas | 5.5 million | 73,311 km² | 75.4 / km² |
| Mexico | 126.8 million | 1,965,208 km² | 64.5 / km² |
Sources: JRC (European Commission's Joint Research Centre) work on the GHS built-up grid
Chanal Historical and Projected Population
Estimated Population from 1000 to 2100
Sources:
- JRC (European Commission's Joint Research Centre) work on the GHS built-up grid
- CIESIN (Center for International Earth Science Information Network)
- [Link] Klein Goldewijk, K., Beusen, A., Doelman, J., and Stehfest, E.: Anthropogenic land use estimates for the Holocene – HYDE 3.2, Earth Syst. Sci. Data, 9, 927–953, https://doi.org/10.5194/essd-9-927-2017, 2017.
Human Development Index (HDI)
Statistic composite index of life expectancy, education, and per capita income.
Source: [Link] Kummu, M., Taka, M. &Guillaume, J. Gridded global datasets for Gross Domestic Product and Human Development Index over 1990–2015. Sci Data 5, 180004 (2018) doi:10.1038/sdata.2018.4
Chanal Gross Domestic Product (GDP)
GDP per capita, PPP (constant 2017 international $)
| Data | 1990 | 1995 | 2000 | 2005 | 2010 | 2015 | 2020 | 2022 |
|---|---|---|---|---|---|---|---|---|
| GDP per capita | $4,148 | $4,404 | $6,146 | $6,356 | $8,120 | $6,851 | $4,815 | $5,191 |
| Total GDP | $46.9M | $56.7M | $81.8M | $96.9M | $140.3M | $133.5M | $107.6M | $117.7M |
Source: [Link] Kummu, M., Kosonen, M. & Masoumzadeh Sayyar, S. Downscaled gridded global dataset for gross domestic product (GDP) per capita PPP over 1990–2022. Sci Data 12, 178 (2025) doi:10.1038/s41597-025-04487-x
Chanal CO2 Emissions
Carbon Dioxide (CO2) Emissions Per Capita in Tonnes Per Year
| Location | CO2 Emissions | CO2 Emissions Per Capita | CO2 Emissions Intensity |
|---|---|---|---|
| Chanal | 44,237 tn | 3.07 tn | 128.2 tons/km² |
| Chiapas | 17,416,827 tn | 3.15 tn | 237.6 tons/km² |
| Mexico | 496,865,013 tn | 3.92 tn | 252.8 tons/km² |
Sources: [Link] Moran, D., Kanemoto K; Jiborn, M., Wood, R., Többen, J., and Seto, K.C. (2018) Carbon footprints of 13,000 cities. Environmental Research Letters DOI: 10.1088/1748-9326/aac72a
Chanal CO2 Emissions
| 2013 CO2 emissions (tonnes/year) | 44,237 tn |
| 2013 CO2 emissions (tonnes/year) per capita | 3.07 tn |
| 2013 CO2 emissions intensity (tonnes/km²/year) | 128.2 tons/km² |
Natural Hazards Risk
Relative risk out of 10
| Hazard | Risk Level |
|---|---|
| Drought | High (10) |
| Flood | Medium (7) |
| Earthquake | Medium (6) |
| Landslide | Medium (7) |
* Risk, particularly concerning flood or landslide, may not be for the entire area.
Sources:
- Dilley, M., R.S. Chen, U. Deichmann, A.L. Lerner-Lam, M. Arnold, J. Agwe, P. Buys, O. Kjekstad, B. Lyon, and G. Yetman. 2005. Natural Disaster Hotspots: A Global Risk Analysis. Washington, D.C.: World Bank. https://doi.org/10.1596/0-8213-5930-4.
- Center for Hazards and Risk Research - CHRR - Columbia University, Center for International Earth Science Information Network - CIESIN - Columbia University, and Norwegian Geotechnical Institute - NGI. 2005. Global Landslide Hazard Distribution. Palisades, NY: NASA Socioeconomic Data and Applications Center (SEDAC). https://doi.org/10.7927/H4P848VZ.
- Center for Hazards and Risk Research - CHRR - Columbia University, Center for International Earth Science Information Network - CIESIN - Columbia University, and International Research Institute for Climate and Society - IRI - Columbia University. 2005. Global Drought Hazard Frequency and Distribution. Palisades, NY: NASA Socioeconomic Data and Applications Center (SEDAC). https://doi.org/10.7927/H4VX0DFT.
- Center for Hazards and Risk Research - CHRR - Columbia University, Center for International Earth Science Information Network - CIESIN - Columbia University. 2005. Global Flood Hazard Frequency and Distribution. Palisades, NY: NASA Socioeconomic Data and Applications Center (SEDAC). https://doi.org/10.7927/H4668B3D.
- Center for Hazards and Risk Research - CHRR - Columbia University, Center for International Earth Science Information Network - CIESIN - Columbia University. 2005. Global Earthquake Hazard Distribution - Peak Ground Acceleration. Palisades, NY: NASA Socioeconomic Data and Applications Center (SEDAC). https://doi.org/10.7927/H4BZ63ZS.
Recent Nearby Earthquakes
Magnitude 3.0 and greater
| Date▼ | Time↕ | Magnitude↕ | Distance↕ | Depth↕ | Location↕ | Link |
|---|---|---|---|---|---|---|
| 7/2/19 | 7:41 PM | 4.3 | 94.4 km | 233,670 m | 11km ENE of Chicomuselo, Mexico | usgs.gov |
| 2/1/19 | 2:03 PM | 4.1 | 85.7 km | 10,000 m | 15km NNE of Pueblo Nuevo Solistahuacan, Mexico | usgs.gov |
| 7/28/18 | 5:36 PM | 4.3 | 86.1 km | 162,780 m | 26km NNW of Angel Albino Corzo, Mexico | usgs.gov |
| 12/31/17 | 9:22 PM | 4.4 | 81.6 km | 207,460 m | 30km NE of San Pedro Buenavista, Mexico | usgs.gov |
| 8/21/17 | 6:39 PM | 4.2 | 73.7 km | 226,210 m | 26km SSW of Chiapilla, Mexico | usgs.gov |
| 2/9/16 | 9:26 PM | 4.9 | 88 km | 209,350 m | 13km NW of Chicomuselo, Mexico | usgs.gov |
| 12/6/15 | 2:52 AM | 4.4 | 74.7 km | 229,680 m | 17km SW of Acala, Mexico | usgs.gov |
| 5/4/15 | 11:33 PM | 4.3 | 76.4 km | 223,420 m | 24km NNW of Chicomuselo, Mexico | usgs.gov |
| 12/5/14 | 9:24 AM | 4 | 85.3 km | 20,920 m | 8km WSW of Tila, Mexico | usgs.gov |
| 11/29/14 | 6:28 PM | 4.1 | 93.4 km | 233,190 m | 8km NE of Chicomuselo, Mexico | usgs.gov |
Source: U.S. Geological Survey (USGS)

About Our Data
The data on this page is estimated using a number of publicly available tools and resources. It is provided without warranty, and could contain inaccuracies. Use at your own risk.