Categories in Tecomán
Industries
Business Distribution by Industry in Tecomán
| Industry Description | Number of Establishments |
|---|---|
| Restaurants | 420 |
| Shopping | 344 |
| Grocery stores and supermarkets | 329 |
| Education | 145 |
| Car repair | 140 |
| Clothing stores | 125 |
| Corporate management | 97 |
| Convenience stores | 82 |
| Public administration | 81 |
| All food and beverage | 76 |
| Hardware store | 75 |
| Pharmacies and drug stores | 72 |
| Shopping other | 68 |
Tecomán Facts
| Area | 17.3 km² |
| Population | 102,691 |
| Male Population | 51,446 (50.1%) |
| Female Population | 51,245 (49.9%) |
| Population change (1975 to 2020) | +272.0% |
| Population change (2000 to 2020) | +48.8% |
| Median Age | 25.6 years (Male: 25.2, Female: 26) |
| GDP per capita (PPP) | $21,638 (2022) |
| Area Codes | 346, 467, 499 |
| Neighborhoods | Centro, Unión Sur, Tecomán Centro, Unión Norte, Tepeyac |
| Local Time | |
| Timezone | Central Standard Time |
| Lat & Lng | 18.91678, -103.87786 |
| Postal Codes | 28100, 28110, 28113, 28120, 28123, More |
Map of Tecomán
Interactive Map
Tecomán Population
Years 1975 to 2030
| Data | 1975 | 1990 | 2000 | 2015 | 2020 | 2025* | 2030* |
|---|---|---|---|---|---|---|---|
| Population | 27,602 | 49,819 | 68,998 | 100,270 | 102,691 | 110,751 | 118,856 |
| Population Density | 1,600.1 / km² | 2,888.1 / km² | 3,999.9 / km² | 5,812.8 / km² | 5,953.1 / km² | 6,420.3 / km² | 6,890.2 / km² |
Tecomán Population change from 2000 to 2020
Increase of 48.8% from year 2000 to 2020
| Location | Change since 1975 | Change since 1990 | Change since 2000 |
|---|---|---|---|
| Tecomán | +272% | +106.1% | +48.8% |
| Colima | — | — | — |
| Mexico | — | — | — |
Tecomán Median Age
Median Age: 25.6 years
| Location | Median Age | Median Age (Female) | Median Age (Male) |
|---|---|---|---|
| Tecomán | 25.6 yrs | 26 yrs | 25.2 yrs |
| Colima | 27.1 yrs | 27.6 yrs | 26.5 yrs |
| Mexico | 26.2 yrs | 27 yrs | 25.3 yrs |
Tecomán Population Density
Population Density: 5,953 / km²
| Location | Population | Area | Density |
|---|---|---|---|
| Tecomán | 102,691 | 17.3 km² | 5,953 / km² |
| Colima | 766,209 | 5,784.2 km² | 133 / km² |
| Mexico | 126.8 million | 1,965,208 km² | 64.5 / km² |
Tecomán Historical and Projected Population
Estimated Population from 900 to 2100
- JRC (European Commission's Joint Research Centre) work on the GHS built-up grid
- CIESIN (Center for International Earth Science Information Network)
- [Link] Klein Goldewijk, K., Beusen, A., Doelman, J., and Stehfest, E.: Anthropogenic land use estimates for the Holocene – HYDE 3.2, Earth Syst. Sci. Data, 9, 927–953, https://doi.org/10.5194/essd-9-927-2017, 2017.
Neighborhoods in Tecomán
Percentage of businesses by neighborhood in Tecomán
Postal Codes
Percentage of businesses by Postal Codes in Tecomán
Price Distribution
Business distribution by price for Tecomán
Human Development Index (HDI)
Statistic composite index of life expectancy, education, and per capita income.
Tecomán Gross Domestic Product (GDP)
GDP per capita, PPP (constant 2017 international $)
| Data | 1990 | 1995 | 2000 | 2005 | 2010 | 2015 | 2020 | 2022 |
|---|---|---|---|---|---|---|---|---|
| GDP per capita | $14,870 | $15,660 | $21,293 | $18,568 | $20,955 | $22,377 | $20,015 | $21,638 |
| Total GDP | $61.2M | $78.3M | $123.2M | $124.3M | $158.5M | $191.2M | $207.3M | $230.6M |
Tecomán CO2 Emissions
Carbon Dioxide (CO2) Emissions Per Capita in Tonnes Per Year
| Location | CO2 Emissions | CO2 Emissions Per Capita | CO2 Emissions Intensity |
|---|---|---|---|
| Tecomán | 436,027 tn | 4.25 tn | 25,277 tons/km² |
| Colima | 3,151,041 tn | 4.11 tn | 544.8 tons/km² |
| Mexico | 496,865,013 tn | 3.92 tn | 252.8 tons/km² |
| 2013 CO2 emissions (tonnes/year) | 436,027 tn |
| 2013 CO2 emissions (tonnes/year) per capita | 4.25 tn |
| 2013 CO2 emissions intensity (tonnes/km²/year) | 25,277 tons/km² |
Natural Hazards Risk
Relative risk out of 10
| Hazard | Risk Level |
|---|---|
| Drought | Medium (7) |
| Flood | Medium (7) |
| Earthquake | High (10) |
| Cyclone | High (8) |
* Risk, particularly concerning flood or landslide, may not be for the entire area.
- Dilley, M., R.S. Chen, U. Deichmann, A.L. Lerner-Lam, M. Arnold, J. Agwe, P. Buys, O. Kjekstad, B. Lyon, and G. Yetman. 2005. Natural Disaster Hotspots: A Global Risk Analysis. Washington, D.C.: World Bank. https://doi.org/10.1596/0-8213-5930-4.
- Center for Hazards and Risk Research - CHRR - Columbia University, Center for International Earth Science Information Network - CIESIN - Columbia University, International Bank for Reconstruction and Development - The World Bank, and United Nations Environment Programme Global Resource Information Database Geneva - UNEP/GRID-Geneva. 2005. Global Cyclone Hazard Frequency and Distribution. Palisades, NY: NASA Socioeconomic Data and Applications Center (SEDAC). https://doi.org/10.7927/H4CZ353K.
- Center for Hazards and Risk Research - CHRR - Columbia University, Center for International Earth Science Information Network - CIESIN - Columbia University, and International Research Institute for Climate and Society - IRI - Columbia University. 2005. Global Drought Hazard Frequency and Distribution. Palisades, NY: NASA Socioeconomic Data and Applications Center (SEDAC). https://doi.org/10.7927/H4VX0DFT.
- Center for Hazards and Risk Research - CHRR - Columbia University, Center for International Earth Science Information Network - CIESIN - Columbia University. 2005. Global Flood Hazard Frequency and Distribution. Palisades, NY: NASA Socioeconomic Data and Applications Center (SEDAC). https://doi.org/10.7927/H4668B3D.
- Center for Hazards and Risk Research - CHRR - Columbia University, Center for International Earth Science Information Network - CIESIN - Columbia University. 2005. Global Earthquake Hazard Distribution - Peak Ground Acceleration. Palisades, NY: NASA Socioeconomic Data and Applications Center (SEDAC). https://doi.org/10.7927/H4BZ63ZS.
Recent Nearby Earthquakes
Magnitude 3.0 and greater
| Date▼ | Time↕ | Magnitude↕ | Distance↕ | Depth↕ | Location↕ | Link |
|---|---|---|---|---|---|---|
| 4/29/17 | 12:41 PM | 4.3 | 50.2 km | 10,000 m | 11km SW of Minatitlan, Mexico | usgs.gov |
| 9/2/15 | 8:25 PM | 4.7 | 19.5 km | 24,240 m | 12km WNW of Coahuayana, Mexico | usgs.gov |
| 8/31/15 | 6:47 AM | 4.4 | 33.5 km | 21,650 m | 17km ENE of El Colomo, Mexico | usgs.gov |
| 8/12/14 | 2:36 AM | 4.2 | 24.6 km | 10,300 m | 5km N of Coahuayana, Mexico | usgs.gov |
| 10/2/13 | 4:43 PM | 4.3 | 40.3 km | 48,210 m | 38km SSW of Armeria, Mexico | usgs.gov |
| 8/6/13 | 12:49 AM | 3.9 | 47.1 km | 32,100 m | 7km NNW of El Colomo, Mexico | usgs.gov |
| 7/2/13 | 10:36 PM | 4 | 33.8 km | 2,300 m | 9km WNW of Armeria, Mexico | usgs.gov |
| 5/12/13 | 9:55 AM | 4 | 35.8 km | 3,400 m | 24km NE of Coahuayana, Mexico | usgs.gov |
| 3/14/13 | 12:45 AM | 4 | 44.4 km | 16,000 m | offshore Michoacan, Mexico | usgs.gov |
| 2/20/13 | 9:23 PM | 5.6 | 43.9 km | 18,000 m | 20km S of Coahuayana, Mexico | usgs.gov |
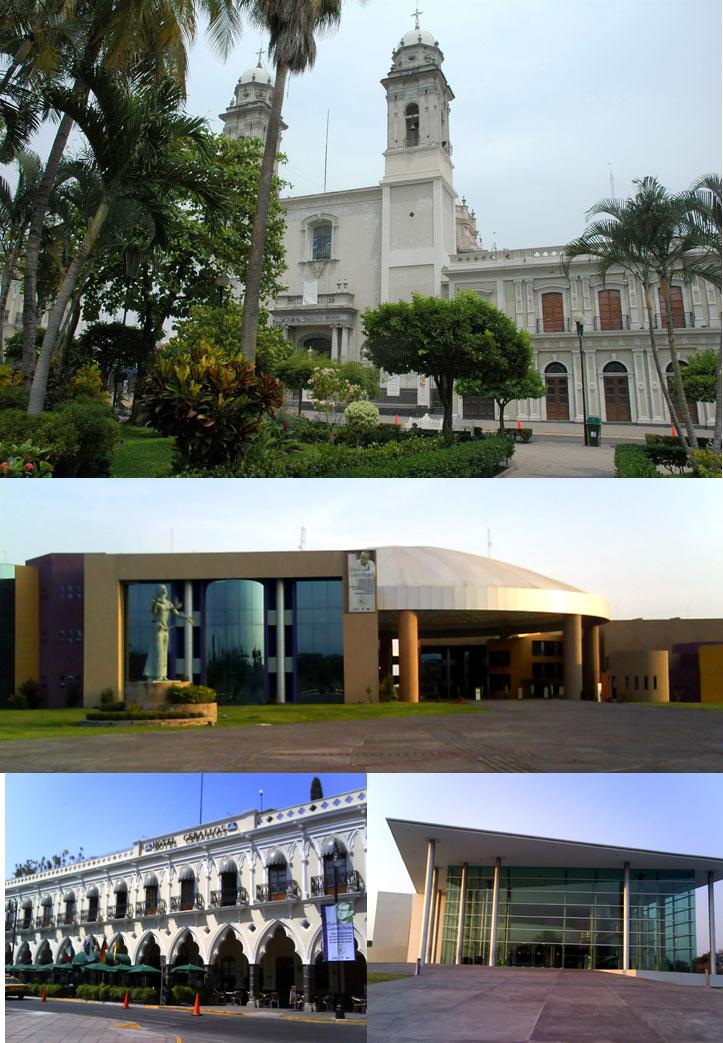
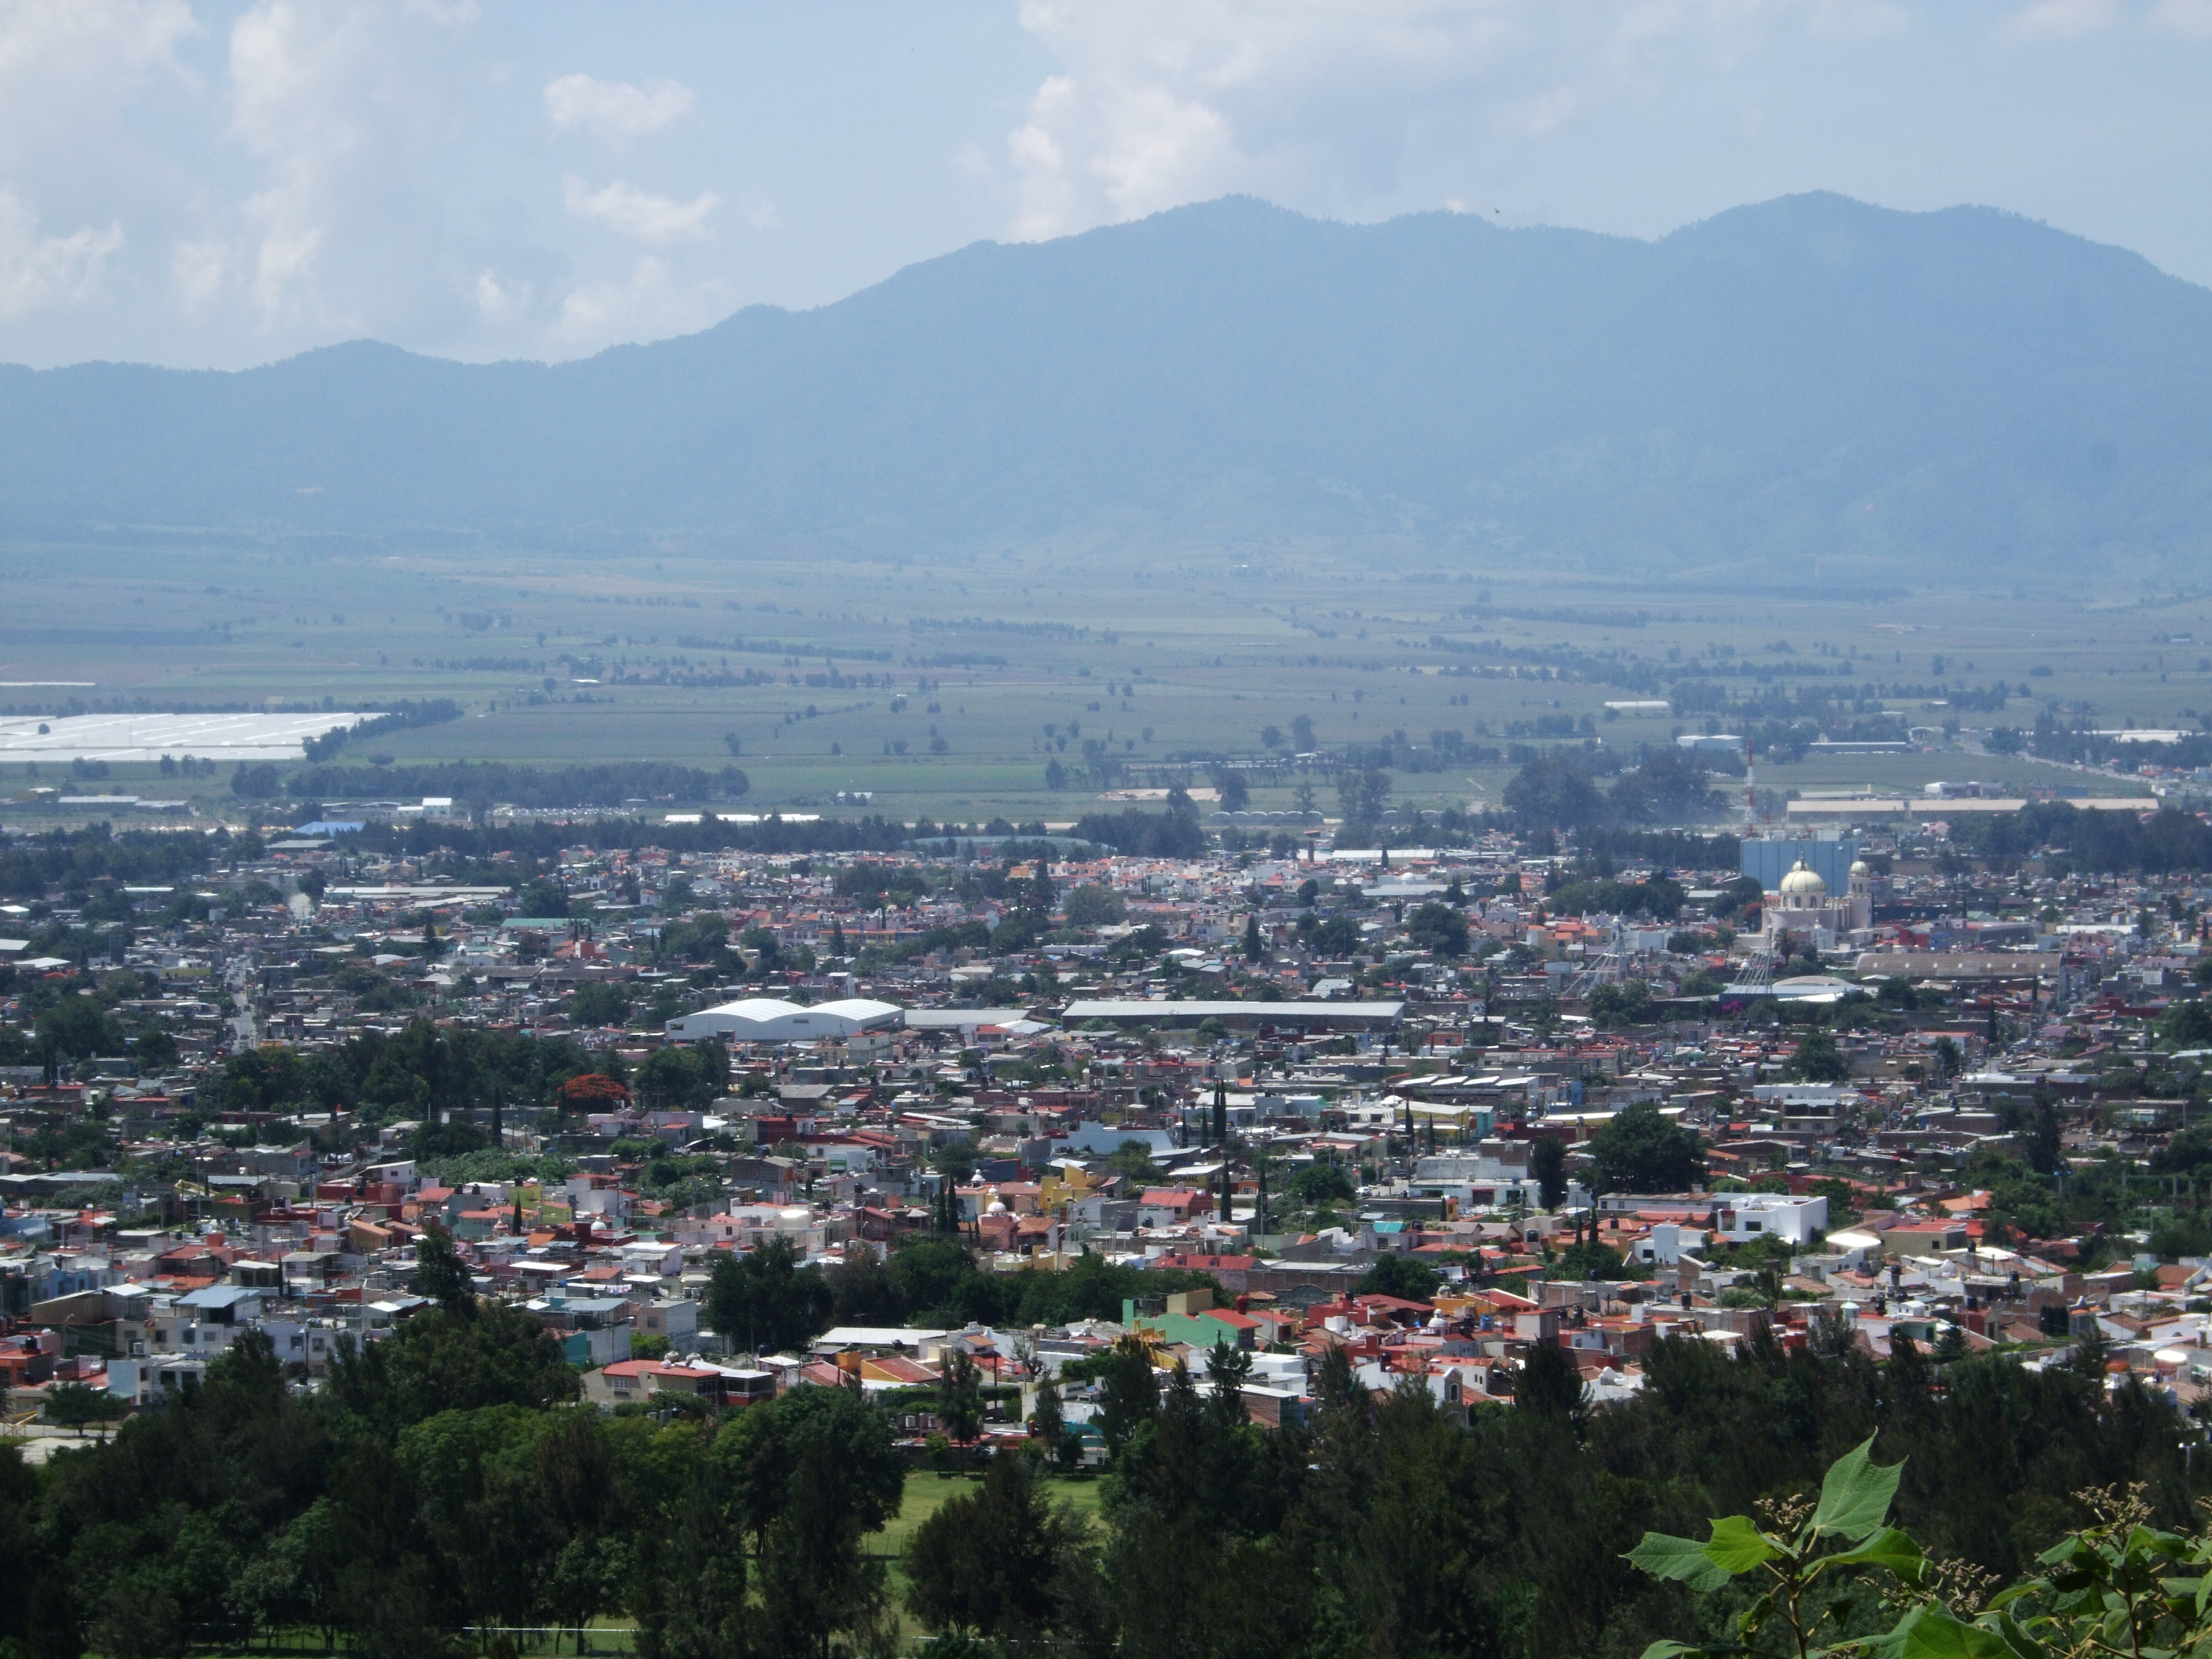
Tecomán
Tecomán is a city and seat of the municipality of Tecomán in the Mexican state of Colima, about 50 km south of the city of Colima. In the 2005 census the city had a population of 112,726 people. It is the third-largest community in the state of Colim..
Tecomán Wikipedia Page

About Our Data
The data on this page is estimated using a number of publicly available tools and resources. It is provided without warranty, and could contain inaccuracies. Use at your own risk.