Categories in Teotongo
Teotongo Facts
| Area | 1.6 km² |
| Population | 568 |
| Male Population | 254 (44.7%) |
| Female Population | 314 (55.3%) |
| Population change (1975 to 2020) | +40.9% |
| Population change (2000 to 2020) | +4.8% |
| Median Age | 31.7 years (Male: 32.9, Female: 30.3) |
| Area Codes | 467 |
| Local Time | |
| Timezone | Central Standard Time |
| Lat & Lng | 17.72475, -97.53499 |
| Postal Codes | 69520 |
Map of Teotongo
Interactive Map
Teotongo Population
Years 1975 to 2020
| Data | 1975 | 1990 | 2000 | 2015 | 2020 |
|---|---|---|---|---|---|
| Population | 403 | 502 | 542 | 542 | 568 |
| Population Density | 248 / km² | 308.9 / km² | 333.5 / km² | 333.5 / km² | 349.5 / km² |
Teotongo Population change from 2000 to 2015
Increase of 0% from year 2000 to 2015
| Location | Change since 1975 | Change since 1990 | Change since 2000 |
|---|---|---|---|
| Teotongo | +34.5% | +8% | +0% |
| Oaxaca | +95.2% | +44.6% | +21.8% |
| Mexico | +108.7% | +48.4% | +23.5% |
Teotongo Median Age
Median Age: 31.7 years
| Location | Median Age | Median Age (Female) | Median Age (Male) |
|---|---|---|---|
| Teotongo | 31.7 yrs | 30.3 yrs | 32.9 yrs |
| Oaxaca | 24.7 yrs | 25.8 yrs | 23.5 yrs |
| Mexico | 26.2 yrs | 27 yrs | 25.3 yrs |
Teotongo Population Density
Population Density: 350 / km²
| Location | Population | Area | Density |
|---|---|---|---|
| Teotongo | 568 | 1.625 km² | 350 / km² |
| Oaxaca | 4.3 million | 93,757.8 km² | 45.4 / km² |
| Mexico | 126.8 million | 1,965,208 km² | 64.5 / km² |
Teotongo Historical and Projected Population
Estimated Population from 0 to 2100
- JRC (European Commission's Joint Research Centre) work on the GHS built-up grid
- CIESIN (Center for International Earth Science Information Network)
- [Link] Klein Goldewijk, K., Beusen, A., Doelman, J., and Stehfest, E.: Anthropogenic land use estimates for the Holocene – HYDE 3.2, Earth Syst. Sci. Data, 9, 927–953, https://doi.org/10.5194/essd-9-927-2017, 2017.
Human Development Index (HDI)
Statistic composite index of life expectancy, education, and per capita income.
Teotongo CO2 Emissions
Carbon Dioxide (CO2) Emissions Per Capita in Tonnes Per Year
| Location | CO2 Emissions | CO2 Emissions Per Capita | CO2 Emissions Intensity |
|---|---|---|---|
| Teotongo | 1,824 tn | 3.21 tn | 1,122.8 tons/km² |
| Oaxaca | 13,736,413 tn | 3.22 tn | 146.5 tons/km² |
| Mexico | 496,865,013 tn | 3.92 tn | 252.8 tons/km² |
| 2013 CO2 emissions (tonnes/year) | 1,824 tn |
| 2013 CO2 emissions (tonnes/year) per capita | 3.21 tn |
| 2013 CO2 emissions intensity (tonnes/km²/year) | 1,122.8 tons/km² |
Natural Hazards Risk
Relative risk out of 10
| Hazard | Risk Level |
|---|---|
| Drought | Medium (4) |
| Flood | High (8) |
| Earthquake | High (8) |
| Landslide | Medium (7) |
* Risk, particularly concerning flood or landslide, may not be for the entire area.
- Dilley, M., R.S. Chen, U. Deichmann, A.L. Lerner-Lam, M. Arnold, J. Agwe, P. Buys, O. Kjekstad, B. Lyon, and G. Yetman. 2005. Natural Disaster Hotspots: A Global Risk Analysis. Washington, D.C.: World Bank. https://doi.org/10.1596/0-8213-5930-4.
- Center for Hazards and Risk Research - CHRR - Columbia University, Center for International Earth Science Information Network - CIESIN - Columbia University, and Norwegian Geotechnical Institute - NGI. 2005. Global Landslide Hazard Distribution. Palisades, NY: NASA Socioeconomic Data and Applications Center (SEDAC). https://doi.org/10.7927/H4P848VZ.
- Center for Hazards and Risk Research - CHRR - Columbia University, Center for International Earth Science Information Network - CIESIN - Columbia University, and International Research Institute for Climate and Society - IRI - Columbia University. 2005. Global Drought Hazard Frequency and Distribution. Palisades, NY: NASA Socioeconomic Data and Applications Center (SEDAC). https://doi.org/10.7927/H4VX0DFT.
- Center for Hazards and Risk Research - CHRR - Columbia University, Center for International Earth Science Information Network - CIESIN - Columbia University. 2005. Global Flood Hazard Frequency and Distribution. Palisades, NY: NASA Socioeconomic Data and Applications Center (SEDAC). https://doi.org/10.7927/H4668B3D.
- Center for Hazards and Risk Research - CHRR - Columbia University, Center for International Earth Science Information Network - CIESIN - Columbia University. 2005. Global Earthquake Hazard Distribution - Peak Ground Acceleration. Palisades, NY: NASA Socioeconomic Data and Applications Center (SEDAC). https://doi.org/10.7927/H4BZ63ZS.
Recent Nearby Earthquakes
Magnitude 3.0 and greater
| Date▼ | Time↕ | Magnitude↕ | Distance↕ | Depth↕ | Location↕ | Link |
|---|---|---|---|---|---|---|
| 7/24/18 | 12:48 PM | 4.2 | 41.8 km | 64,989 m | 26km N of Huajuapan de Leon, Mexico | usgs.gov |
| 7/19/18 | 1:31 PM | 5.8 | 29.9 km | 48,460 m | 15km NNE of Huajuapan de Leon, Mexico | usgs.gov |
| 5/30/18 | 2:53 PM | 4.4 | 48.5 km | 58,080 m | 26km NNE of Santiago Juxtlahuaca, Mexico | usgs.gov |
| 7/24/16 | 3:20 PM | 4.5 | 25.7 km | 55,730 m | 27km NE of San Sebastian Tutla, Mexico | usgs.gov |
| 1/13/15 | 3:22 PM | 4 | 63.5 km | 72,850 m | 21km SSE of Asuncion Nochixtlan, Mexico | usgs.gov |
| 2/3/14 | 4:59 PM | 4.1 | 53.4 km | 73,800 m | 10km SE of Asuncion Nochixtlan, Mexico | usgs.gov |
| 12/15/13 | 8:15 AM | 4 | 57.6 km | 75,400 m | 14km ESE of Asuncion Nochixtlan, Mexico | usgs.gov |
| 10/22/12 | 11:35 PM | 4.3 | 21.5 km | 64,800 m | Oaxaca, Mexico | usgs.gov |
| 6/12/12 | 1:37 AM | 4 | 25.6 km | 65,600 m | Oaxaca, Mexico | usgs.gov |
| 5/16/12 | 10:48 AM | 4 | 32.7 km | 63,700 m | Oaxaca, Mexico | usgs.gov |
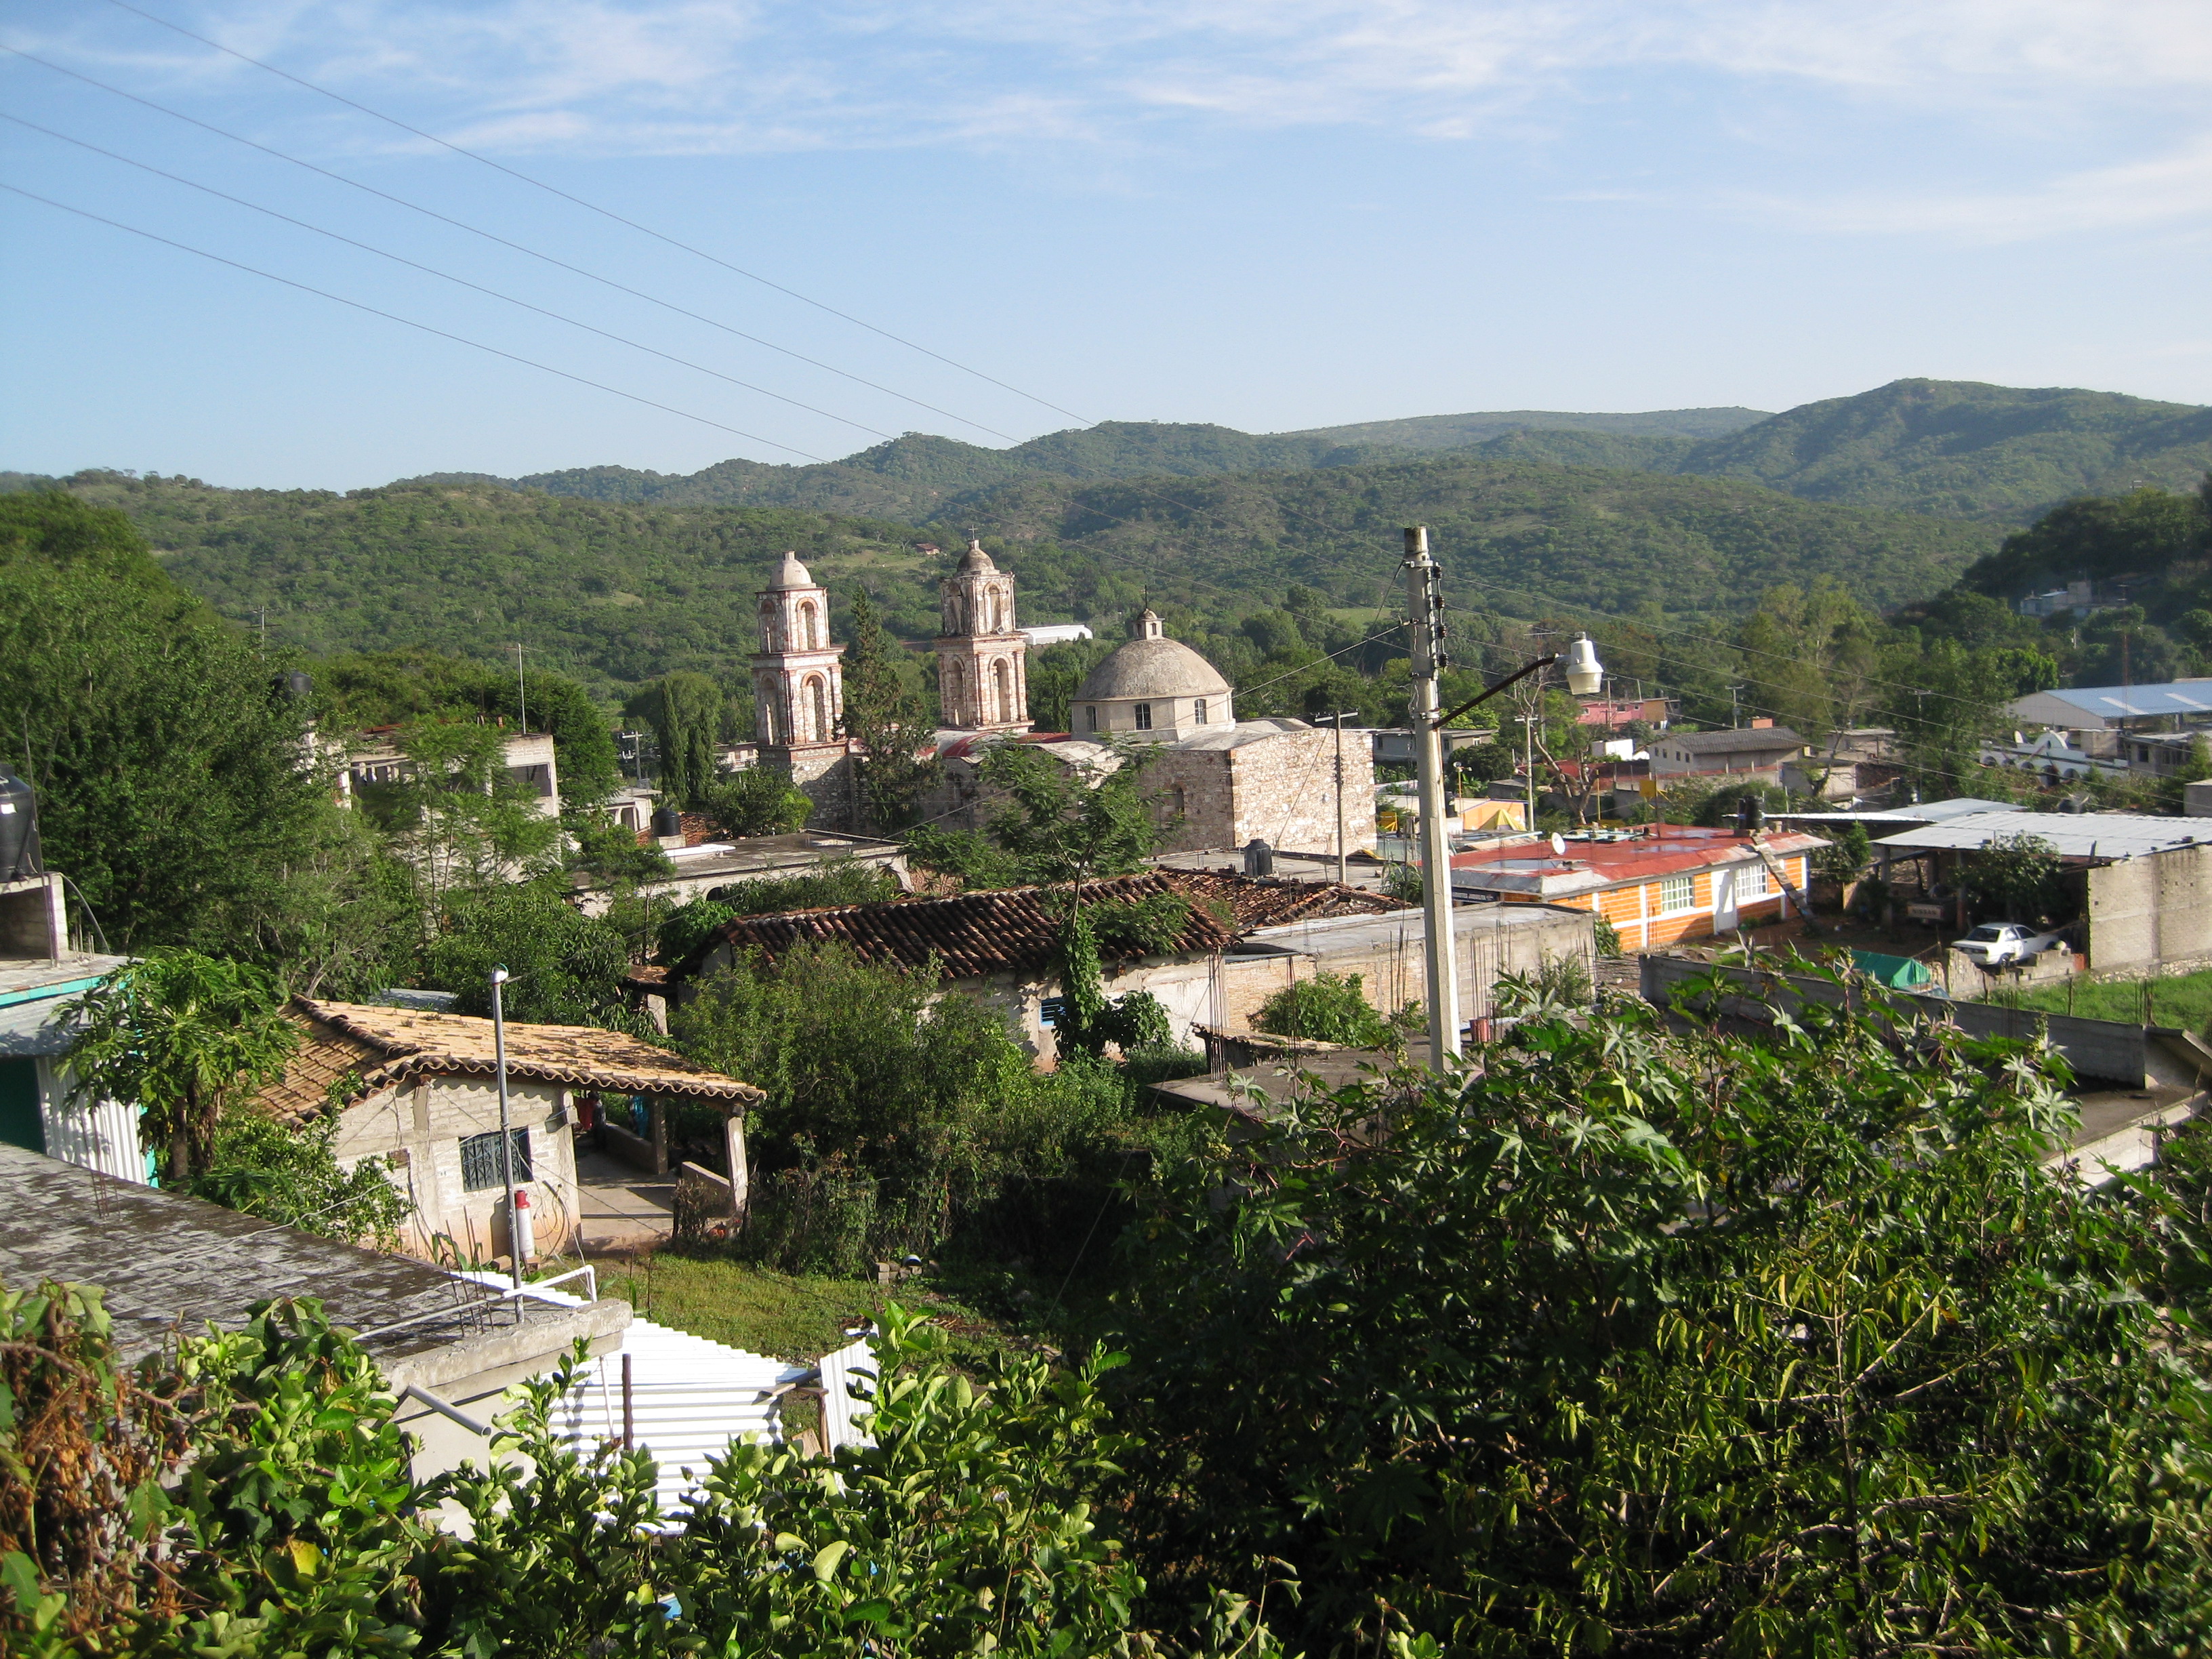
Teotongo
Teotongo is a town and municipality in Oaxaca in south-western Mexico. The municipality covers an area of km². It is part of the Teposcolula District in the center of the Mixteca of 2005, the municipality had a total population of .
Teotongo Wikipedia Page
About Our Data
The data on this page is estimated using a number of publicly available tools and resources. It is provided without warranty, and could contain inaccuracies. Use at your own risk.