Chokocho Facts
| Area | 0.3 km² |
| Population | 9,080 |
| Male Population | 4,645 (51.2%) |
| Female Population | 4,435 (48.8%) |
| Population change (1975 to 2020) | +72.1% |
| Population change (2000 to 2020) | +47.0% |
| Median Age | 20.8 years (Male: 20.2, Female: 21.4) |
| Local Time | |
| Timezone | West Africa Time |
| Lat & Lng | 4.98945, 7.05479 |
Map of Chokocho
Interactive Map
Chokocho Population
Years 1975 to 2020
| Data | 1975 | 1990 | 2000 | 2015 | 2020 |
|---|---|---|---|---|---|
| Population | 5,276 | 4,982 | 6,176 | 8,059 | 9,080 |
| Population Density | 21,104 / km² | 19,928 / km² | 24,704 / km² | 32,236 / km² | 36,320 / km² |
Chokocho Population change from 2000 to 2015
Increase of 30.5% from year 2000 to 2015
| Location | Change since 1975 | Change since 1990 | Change since 2000 |
|---|---|---|---|
| Chokocho | +52.7% | +61.8% | +30.5% |
| Rivers State | +196.6% | +95.3% | +50.3% |
| Nigeria | +186.7% | +90.6% | +48.3% |
Chokocho Median Age
Median Age: 20.8 years
| Location | Median Age | Median Age (Female) | Median Age (Male) |
|---|---|---|---|
| Chokocho | 20.8 yrs | 21.4 yrs | 20.2 yrs |
| Rivers State | 21.1 yrs | 21.3 yrs | 21 yrs |
| Nigeria | 18.9 yrs | 19.3 yrs | 18.5 yrs |
Chokocho Population Density
Population Density: 36,320 / km²
| Location | Population | Area | Density |
|---|---|---|---|
| Chokocho | 9,080 | 0.25 km² | 36,320 / km² |
| Rivers State | 6.9 million | 10,296.2 km² | 667 / km² |
| Nigeria | 182 million | 909,042.9 km² | 200 / km² |
Chokocho Historical and Projected Population
Estimated Population from 600 to 2100
- JRC (European Commission's Joint Research Centre) work on the GHS built-up grid
- CIESIN (Center for International Earth Science Information Network)
- [Link] Klein Goldewijk, K., Beusen, A., Doelman, J., and Stehfest, E.: Anthropogenic land use estimates for the Holocene – HYDE 3.2, Earth Syst. Sci. Data, 9, 927–953, https://doi.org/10.5194/essd-9-927-2017, 2017.
Human Development Index (HDI)
Statistic composite index of life expectancy, education, and per capita income.
Chokocho CO2 Emissions
Carbon Dioxide (CO2) Emissions Per Capita in Tonnes Per Year
| Location | CO2 Emissions | CO2 Emissions Per Capita | CO2 Emissions Intensity |
|---|---|---|---|
| Chokocho | 6,269 tn | 0.69 tn | 25,075 tons/km² |
| Rivers State | 3,999,136 tn | 0.58 tn | 388.4 tons/km² |
| Nigeria | 86,705,254 tn | 0.48 tn | 95.4 tons/km² |
| 2013 CO2 emissions (tonnes/year) | 6,269 tn |
| 2013 CO2 emissions (tonnes/year) per capita | 0.69 tn |
| 2013 CO2 emissions intensity (tonnes/km²/year) | 25,075 tons/km² |
Natural Hazards Risk
Relative risk out of 10
| Hazard | Risk Level |
|---|---|
| Drought | Medium (4) |
* Risk, particularly concerning flood or landslide, may not be for the entire area.
- Dilley, M., R.S. Chen, U. Deichmann, A.L. Lerner-Lam, M. Arnold, J. Agwe, P. Buys, O. Kjekstad, B. Lyon, and G. Yetman. 2005. Natural Disaster Hotspots: A Global Risk Analysis. Washington, D.C.: World Bank. https://doi.org/10.1596/0-8213-5930-4.
- Center for Hazards and Risk Research - CHRR - Columbia University, Center for International Earth Science Information Network - CIESIN - Columbia University, and International Research Institute for Climate and Society - IRI - Columbia University. 2005. Global Drought Hazard Frequency and Distribution. Palisades, NY: NASA Socioeconomic Data and Applications Center (SEDAC). https://doi.org/10.7927/H4VX0DFT.
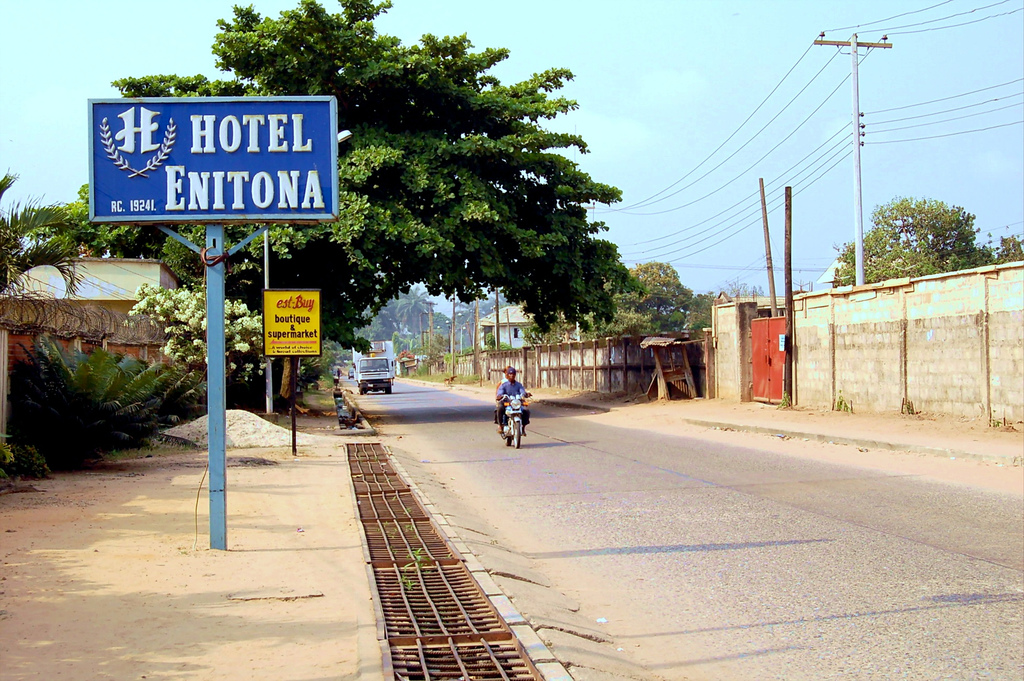
Chokocho
Chokocho is a community in Rivers State, Nigeria near the Otamiri River. The Chokocho bridge across the Otamiri, damaged during the Nigerian civil war, was rebuilt during the governorship of Peter Odili. The bridge on the Igwuruta – Okehi – Okpalla r..
Chokocho Wikipedia Page

About Our Data
The data on this page is estimated using a number of publicly available tools and resources. It is provided without warranty, and could contain inaccuracies. Use at your own risk.