Industries
Business Distribution by Industry in Gandi
| Industry Description | Number of Establishments |
|---|---|
| Primary and elementary schools | 13 |
| Education | 13 |
Gandi Facts
| Area | 1.1 km² |
| Population | 16,598 |
| Male Population | 8,346 (50.3%) |
| Female Population | 8,252 (49.7%) |
| Population change (1975 to 2020) | -20.7% |
| Population change (2000 to 2020) | -34.6% |
| Median Age | 16.2 years (Male: 15, Female: 17.4) |
| Local Time | |
| Timezone | West Africa Time |
| Lat & Lng | 12.96358, 5.74337 |
| Postal Codes | 842103, 842104 |
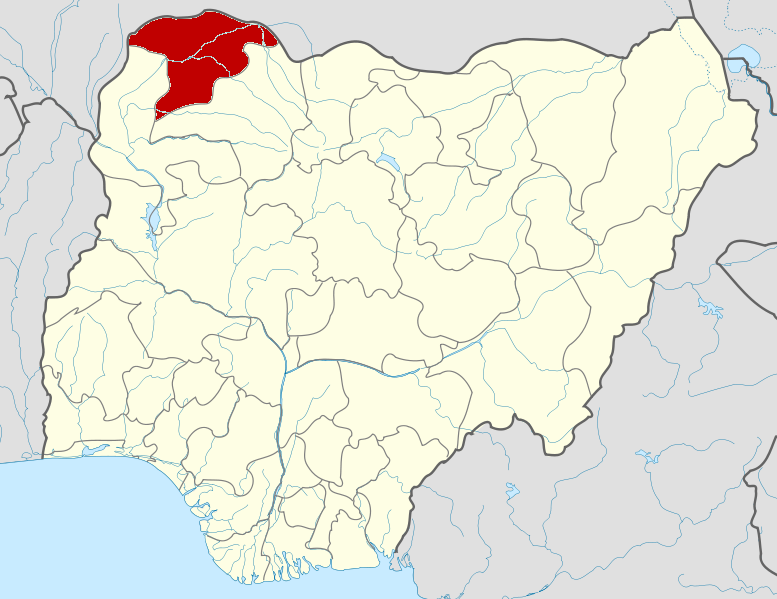
Map of Gandi
Interactive Map
Gandi Population
Years 1975 to 2030
| Data | 1975 | 1990 | 2000 | 2015 | 2020 | 2025* | 2030* |
|---|---|---|---|---|---|---|---|
| Population | 20,940 | 23,296 | 25,379 | 31,770 | 16,598 | 17,026 | 17,881 |
| Population Density | 18,613.3 / km² | 20,707.6 / km² | 22,559.1 / km² | 28,240 / km² | 14,753.8 / km² | 15,134.2 / km² | 15,894.2 / km² |
* Projected
Sources: JRC (European Commission's Joint Research Centre) work on the GHS built-up gridGandi Population change from 2000 to 2020
Decrease of 34.6% from year 2000 to 2020
| Location | Change since 1975 | Change since 1990 | Change since 2000 |
|---|---|---|---|
| Gandi | -20.7% | -28.8% | -34.6% |
| Sokoto State | — | — | — |
| Nigeria | — | — | — |
Sources: JRC (European Commission's Joint Research Centre) work on the GHS built-up grid
Gandi Median Age
Median Age: 16.2 years
| Location | Median Age | Median Age (Female) | Median Age (Male) |
|---|---|---|---|
| Gandi | 16.2 yrs | 17.4 yrs | 15 yrs |
| Sokoto State | 16.3 yrs | 17.3 yrs | 15.3 yrs |
| Nigeria | 18.9 yrs | 19.3 yrs | 18.5 yrs |
Sources: CIESIN (Center for International Earth Science Information Network)
Gandi Population Density
Population Density: 14,754 / km²
| Location | Population | Area | Density |
|---|---|---|---|
| Gandi | 16,598 | 1.125 km² | 14,754 / km² |
| Sokoto State | 4.9 million | 32,032 km² | 152 / km² |
| Nigeria | 182 million | 909,042.9 km² | 200 / km² |
Sources: JRC (European Commission's Joint Research Centre) work on the GHS built-up grid
Gandi Historical and Projected Population
Estimated Population from 200 to 2100
Sources:
- JRC (European Commission's Joint Research Centre) work on the GHS built-up grid
- CIESIN (Center for International Earth Science Information Network)
- [Link] Klein Goldewijk, K., Beusen, A., Doelman, J., and Stehfest, E.: Anthropogenic land use estimates for the Holocene – HYDE 3.2, Earth Syst. Sci. Data, 9, 927–953, https://doi.org/10.5194/essd-9-927-2017, 2017.
Human Development Index (HDI)
Statistic composite index of life expectancy, education, and per capita income.
Source: [Link] Kummu, M., Taka, M. &Guillaume, J. Gridded global datasets for Gross Domestic Product and Human Development Index over 1990–2015. Sci Data 5, 180004 (2018) doi:10.1038/sdata.2018.4
Gandi CO2 Emissions
Carbon Dioxide (CO2) Emissions Per Capita in Tonnes Per Year
| Location | CO2 Emissions | CO2 Emissions Per Capita | CO2 Emissions Intensity |
|---|---|---|---|
| Gandi | 8,041 tn | 0.48 tn | 7,147.3 tons/km² |
| Sokoto State | 2,334,928 tn | 0.48 tn | 72.9 tons/km² |
| Nigeria | 86,705,254 tn | 0.48 tn | 95.4 tons/km² |
Sources: [Link] Moran, D., Kanemoto K; Jiborn, M., Wood, R., Többen, J., and Seto, K.C. (2018) Carbon footprints of 13,000 cities. Environmental Research Letters DOI: 10.1088/1748-9326/aac72a
Gandi CO2 Emissions
| 2013 CO2 emissions (tonnes/year) | 8,041 tn |
| 2013 CO2 emissions (tonnes/year) per capita | 0.48 tn |
| 2013 CO2 emissions intensity (tonnes/km²/year) | 7,147.3 tons/km² |
Natural Hazards Risk
Relative risk out of 10
| Hazard | Risk Level |
|---|---|
| Drought | Medium (5) |
| Flood | Medium (4) |
* Risk, particularly concerning flood or landslide, may not be for the entire area.
Sources:
- Dilley, M., R.S. Chen, U. Deichmann, A.L. Lerner-Lam, M. Arnold, J. Agwe, P. Buys, O. Kjekstad, B. Lyon, and G. Yetman. 2005. Natural Disaster Hotspots: A Global Risk Analysis. Washington, D.C.: World Bank. https://doi.org/10.1596/0-8213-5930-4.
- Center for Hazards and Risk Research - CHRR - Columbia University, Center for International Earth Science Information Network - CIESIN - Columbia University, and International Research Institute for Climate and Society - IRI - Columbia University. 2005. Global Drought Hazard Frequency and Distribution. Palisades, NY: NASA Socioeconomic Data and Applications Center (SEDAC). https://doi.org/10.7927/H4VX0DFT.
- Center for Hazards and Risk Research - CHRR - Columbia University, Center for International Earth Science Information Network - CIESIN - Columbia University. 2005. Global Flood Hazard Frequency and Distribution. Palisades, NY: NASA Socioeconomic Data and Applications Center (SEDAC). https://doi.org/10.7927/H4668B3D.
About Our Data
The data on this page is estimated using a number of publicly available tools and resources. It is provided without warranty, and could contain inaccuracies. Use at your own risk.