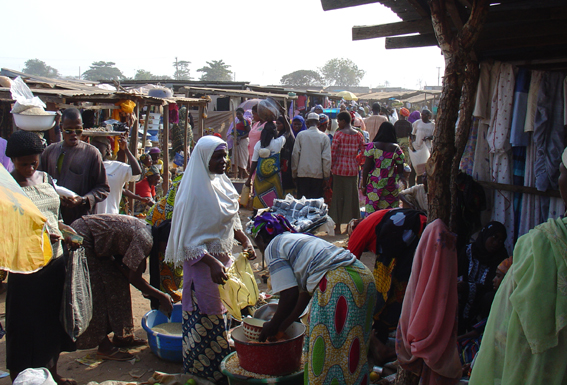
Categories in Gwagwalada
Industries
Business Distribution by Industry in Gwagwalada
| Industry Description | Number of Establishments |
|---|---|
| Shopping other | 461 |
| Shopping | 117 |
| Education | 113 |
| Clothing stores | 110 |
| Churches | 99 |
| Pharmacies and drug stores | 85 |
| Restaurants | 76 |
| Religion | 67 |
| Corporate management | 54 |
| Hospitals | 46 |
| Hotels and motels | 46 |
| Beauty salons | 45 |
| Electronics stores | 44 |
| Gas station | 41 |
Gwagwalada Facts
| Area | 8.0 km² |
| Population | 258,848 |
| Male Population | 135,637 (52.4%) |
| Female Population | 123,211 (47.6%) |
| Population change (1975 to 2020) | +2369.5% |
| Population change (2000 to 2020) | +242.0% |
| Median Age | 21.7 years (Male: 23.5, Female: 20.2) |
| Neighborhoods | Phase 3, Dagiri |
| Local Time | |
| Timezone | West Africa Time |
| Lat & Lng | 8.94342, 7.08165 |
Map of Gwagwalada
Interactive Map
Gwagwalada Population
Years 1975 to 2020
| Data | 1975 | 1990 | 2000 | 2015 | 2020 |
|---|---|---|---|---|---|
| Population | 10,482 | 37,685 | 75,683 | 229,702 | 258,848 |
| Population Density | 1,310.3 / km² | 4,710.6 / km² | 9,460.4 / km² | 28,712.8 / km² | 32,356 / km² |
Gwagwalada Population change from 2000 to 2015
Increase of 203.5% from year 2000 to 2015
| Location | Change since 1975 | Change since 1990 | Change since 2000 |
|---|---|---|---|
| Gwagwalada | +2091.4% | +509.5% | +203.5% |
| Federal Capital Territory, Nigeria | +1800.9% | +600.1% | +232.7% |
| Nigeria | +186.7% | +90.6% | +48.3% |
Gwagwalada Median Age
Median Age: 21.7 years
| Location | Median Age | Median Age (Female) | Median Age (Male) |
|---|---|---|---|
| Gwagwalada | 21.7 yrs | 20.2 yrs | 23.5 yrs |
| Federal Capital Territory, Nigeria | 21.3 yrs | 19.9 yrs | 23 yrs |
| Nigeria | 18.9 yrs | 19.3 yrs | 18.5 yrs |
Gwagwalada Population Density
Population Density: 32,356 / km²
| Location | Population | Area | Density |
|---|---|---|---|
| Gwagwalada | 258,848 | 8 km² | 32,356 / km² |
| Federal Capital Territory, Nigeria | 3.1 million | 7,568.9 km² | 415 / km² |
| Nigeria | 182 million | 909,042.9 km² | 200 / km² |
Gwagwalada Historical and Projected Population
Estimated Population from 1940 to 2100
- JRC (European Commission's Joint Research Centre) work on the GHS built-up grid
- CIESIN (Center for International Earth Science Information Network)
- [Link] Klein Goldewijk, K., Beusen, A., Doelman, J., and Stehfest, E.: Anthropogenic land use estimates for the Holocene – HYDE 3.2, Earth Syst. Sci. Data, 9, 927–953, https://doi.org/10.5194/essd-9-927-2017, 2017.
Area Codes
Percentage Area Codes used by businesses in Gwagwalada
Price Distribution
Business distribution by price for Gwagwalada
Human Development Index (HDI)
Statistic composite index of life expectancy, education, and per capita income.
Gwagwalada CO2 Emissions
Carbon Dioxide (CO2) Emissions Per Capita in Tonnes Per Year
| Location | CO2 Emissions | CO2 Emissions Per Capita | CO2 Emissions Intensity |
|---|---|---|---|
| Gwagwalada | 181,767 tn | 0.7 tn | 22,720.9 tons/km² |
| Federal Capital Territory, Nigeria | 2,089,425 tn | 0.67 tn | 276.1 tons/km² |
| Nigeria | 86,705,254 tn | 0.48 tn | 95.4 tons/km² |
| 2013 CO2 emissions (tonnes/year) | 181,767 tn |
| 2013 CO2 emissions (tonnes/year) per capita | 0.7 tn |
| 2013 CO2 emissions intensity (tonnes/km²/year) | 22,720.9 tons/km² |
Gwagwalada
Gwagwalada is one of the six Local Government Area Councils of the Federal Capital Territory of Nigeria, together with Abaji, Kuje, Bwari, and Kwali; and the Abuja Municipal Area Council (AMAC). Gwagwalada is also the name of the main town in the Loc..
Gwagwalada Wikipedia Page
About Our Data
The data on this page is estimated using a number of publicly available tools and resources. It is provided without warranty, and could contain inaccuracies. Use at your own risk.